How can I get assistance for archelios? onlineHelp
- This FAQ
- Online help in archelios software. Each section contains its own help feature :
 When you click on this link, help is displayed.
 - Our YouTube videos : Click here
- If your question remains unanswered, please contact us directly: https://support.trace-software.com/Pages/login.aspx
Can I test archelios PRO? trialVersion
Yes, you can test the entire archelios PRO suite.
By default, you have access to archelios PRO FREE, which allows you to design projects up to 36 kWp for free.
You can apply for a loan with our sales teams:
- France: +33 (0)2 32 79 44 24 | commercial@trace-software.com
- China:8 613 818 830 679| rwang@trace-software.com
- Germany: +49 (0) 151 16528462| sales@trace-software.com
- Morocco: +212 645 51 08 27| maroc@trace-software.com
- International: +33 (0)2 32 79 44 24| sales@trace-software.com
- Using the following form: here
At the end of your loan, you have two options :
- You buy archelios PRO PREMIUM and take advantage of the features in the chosen range.
- Your trial period will end, and you will have access to your previous version of archelios PRO.
What features are included in my version of archelios PRO? featuresInEachVersion
Click on the images to see a detailed list of features available in the chosen version :
Can I change my password? changePassword
Can I share a project? shareProject
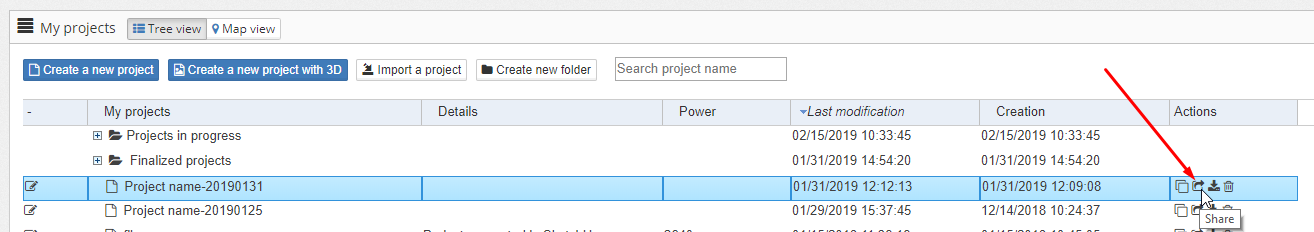
However, please note that this operation is irreversible. It will create a copy of the project on the other user's workstation. It will be completely independent from the original file, and you will not see the other user's changes unless he/she shares the project with you.
SketchUp
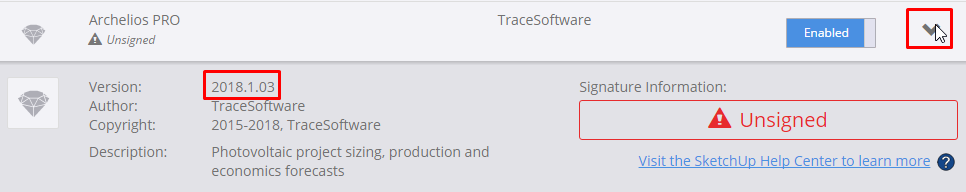
How can I find out the version of the archelios plug-in? pluginVersionSU
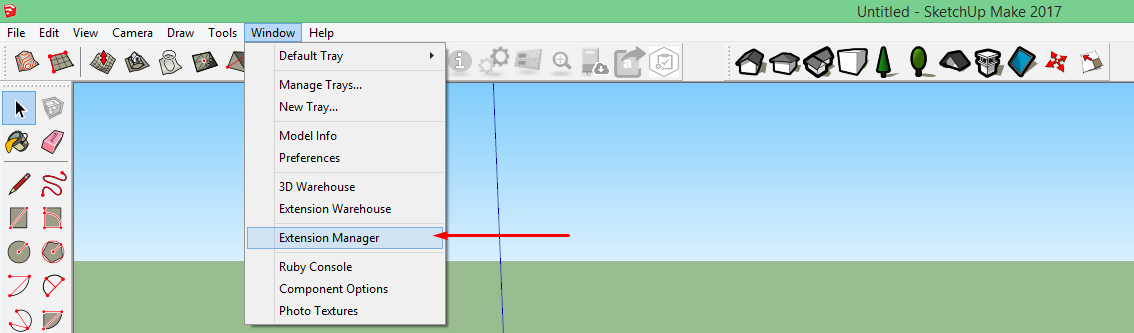
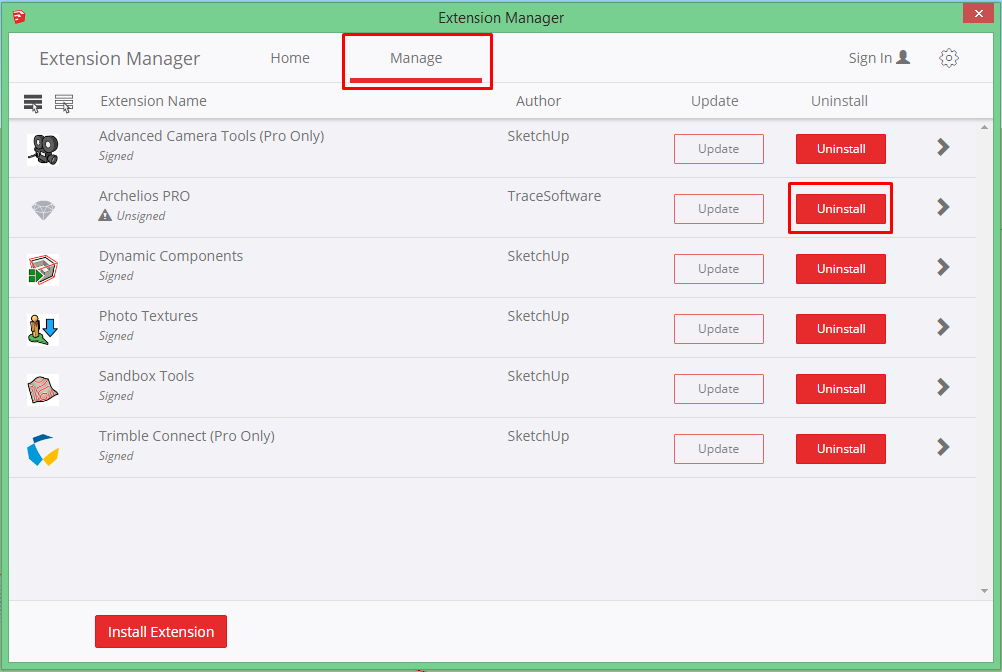
You can see the version number in the 'Window' menu. Click on 'Extension Manager' and choose archelios
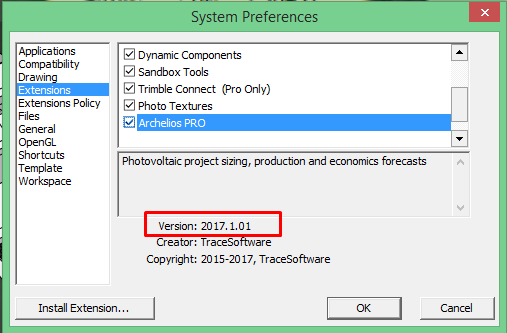
SketchUp versions < 2017
You can see the version number in the 'Window' menu. Click on 'Preferences' and choose archelios
How can I update the archelios plug-in? updatePluginSU
Installation with the setup file (for Windows):
SketchUp must already be installed
- Close all SketchUp windows.
-
Download the latest version of the plugin setup file.
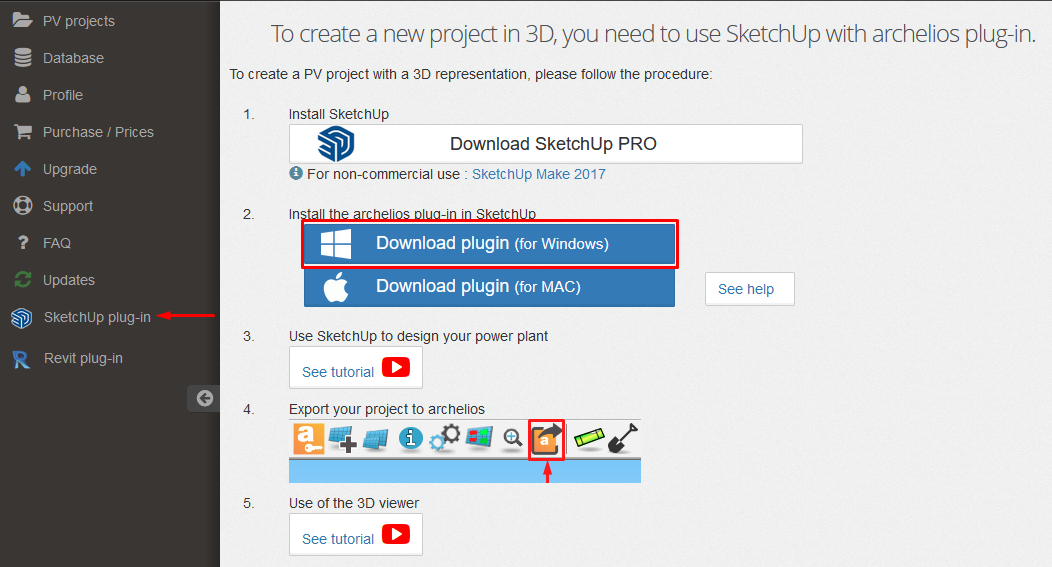
- Run the setup file (.exe).
-
Choose your SketchUp version where the plugins will be installed.
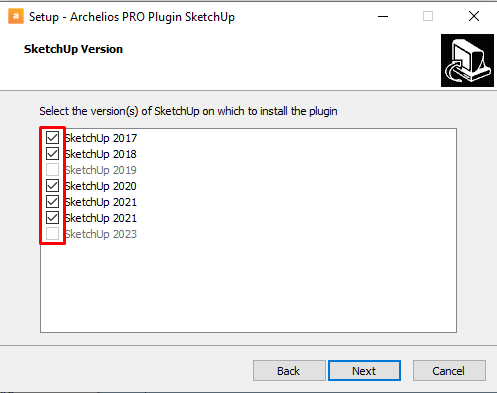
- Complete the installation and restart SketchUp.
Manual installation with the rbz file (for Windows and MAC):
-
First you need to uninstall the archelios plug-in and close SketchUp
-
Then download the new version of the archelios plug-in from your online account
-
Go back to SketchUp in the Extension Manager and install the new plug-in (.rbz file)
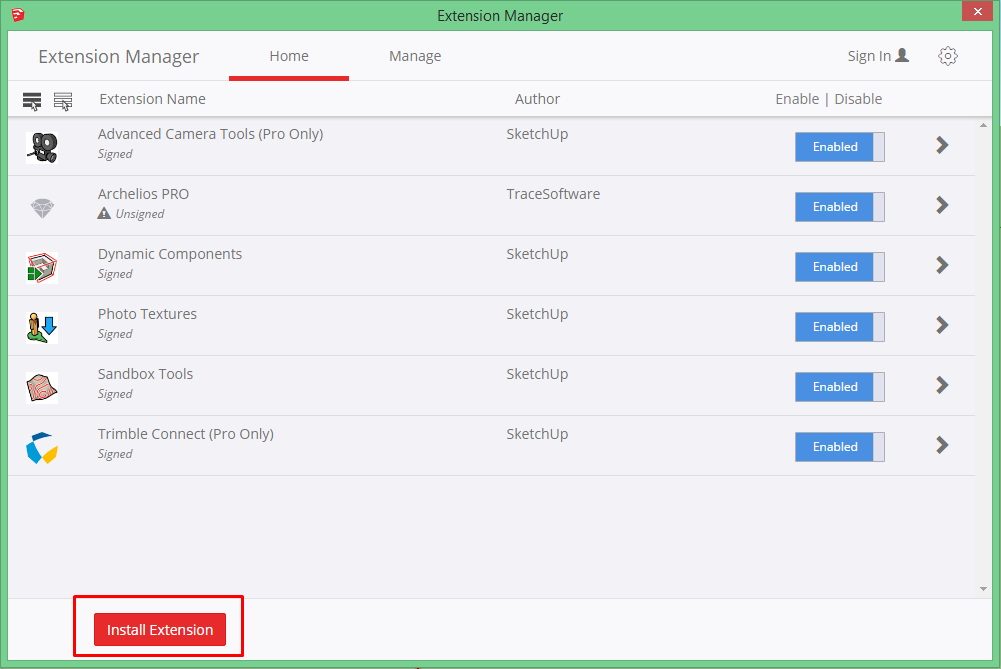
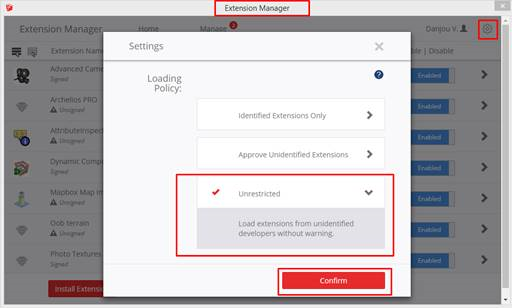
SketchUp no longer wants to install the plug-in. What can I do? unrestrictedPluginSU
You need to change the plug-in settings
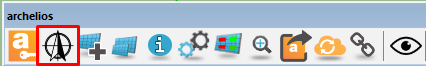
How do I define the axes to solar north? northAxesSU
SketchUp runs with a grid north (the green axis by default). Solar north could be different by a few degrees.
To set the green axis to solar north, use the compass button.
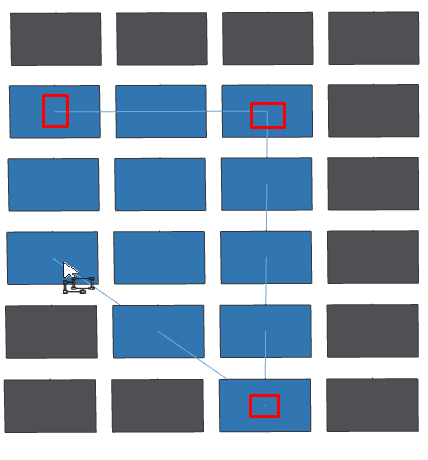
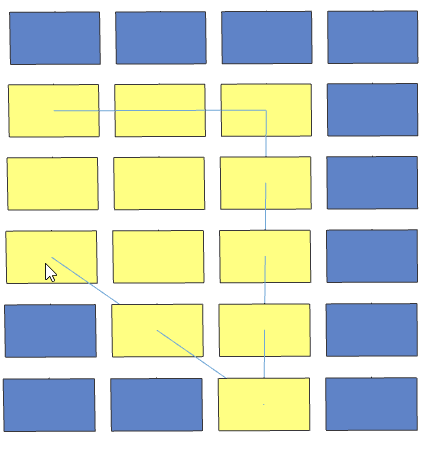
How do you create the layout of the modules? layoutModules
To duplicate the module, archelios uses 4 points (the corners of the module) and checks if they are on the surface without obstacles. However, for performance reasons, modules which have a shorter obstacle size may be placed on the surface. Indeed, it would take too long to carry out more checks.
The position of the first module is highly important in the layout. It is the starting point for positioning and laying out the modules, and therefore, it will influence the entire duplication process.
This is all the more important for surfaces with lots of obstacles.
Generally speaking, the first module is placed in a corner of the surface to be duplicated.
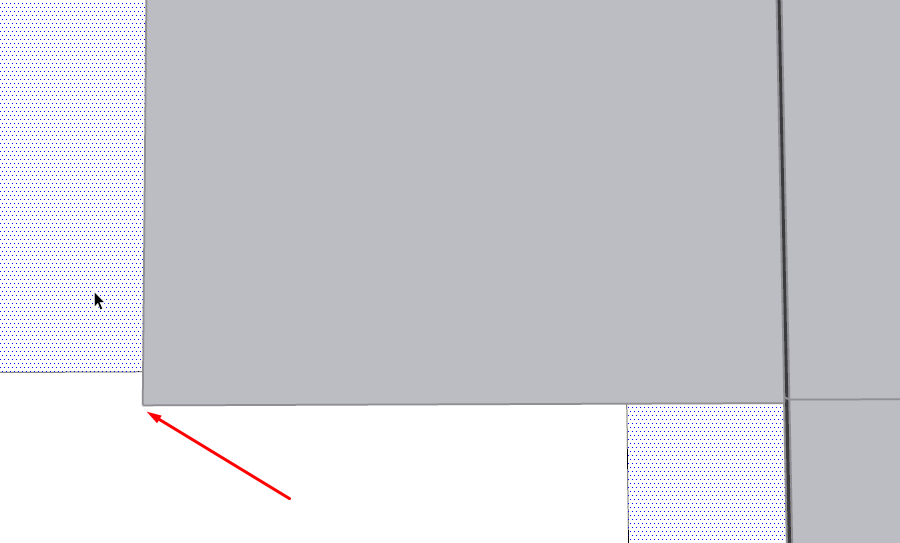
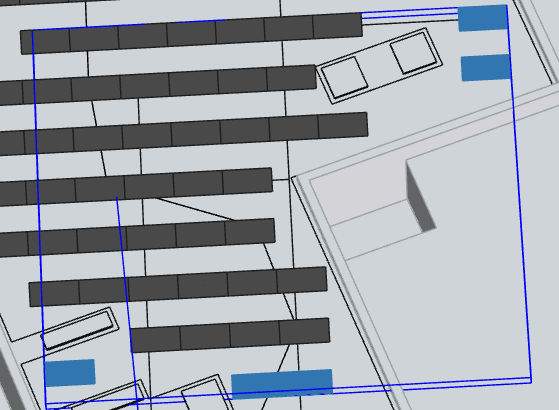
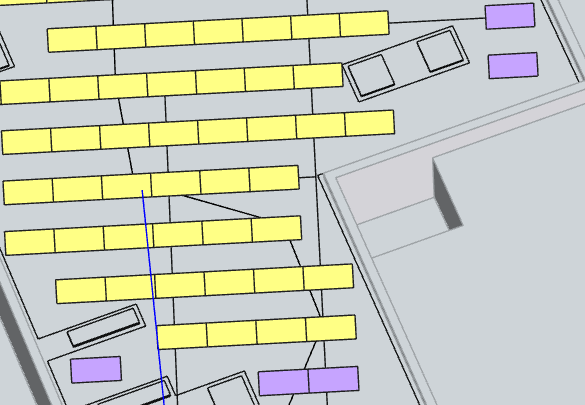
Why is a row missing?
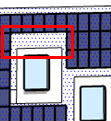
In this case, you might think that a module can be duplicated above
But when zooming in, it can clearly be seen that the corner of the module is not on the duplicated surface (therefore, it will not be placed automatically by archelios).
Check that the path and the filename do not contain any special characters, such as & or \. If any, delete them to allow the export of Archelios Online and the irradiance calculation.
Also, make sure your .skp file is saved in a directory with administrator rights. You can try it by saving your file on the desktop.
archelios PRO needs a special structure in SketchUp in order to recognise photovoltaic elements for all calculations.
This structure is automatically generated by our replication tool.
A correct structure is as follows:
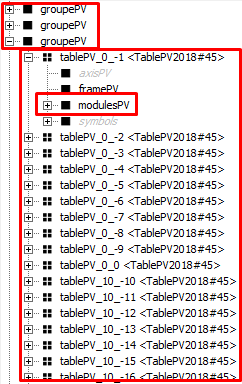
- The group above must be named 'groupePV' and you can have several groups named 'groupePV'
- The 'groupePV' group must contain 'tablePV' and 'modulesPV' elements
It is strongly recommended not to break the 'groupePV' group or the structure!
While you re-create this structure manually, it might not work for some calculations because some parameters are stored in the PV group generated during duplication. If you 'explode' the group or the structure generated by Archelios PRO, those parameters are lost and cannot be re-created manually.
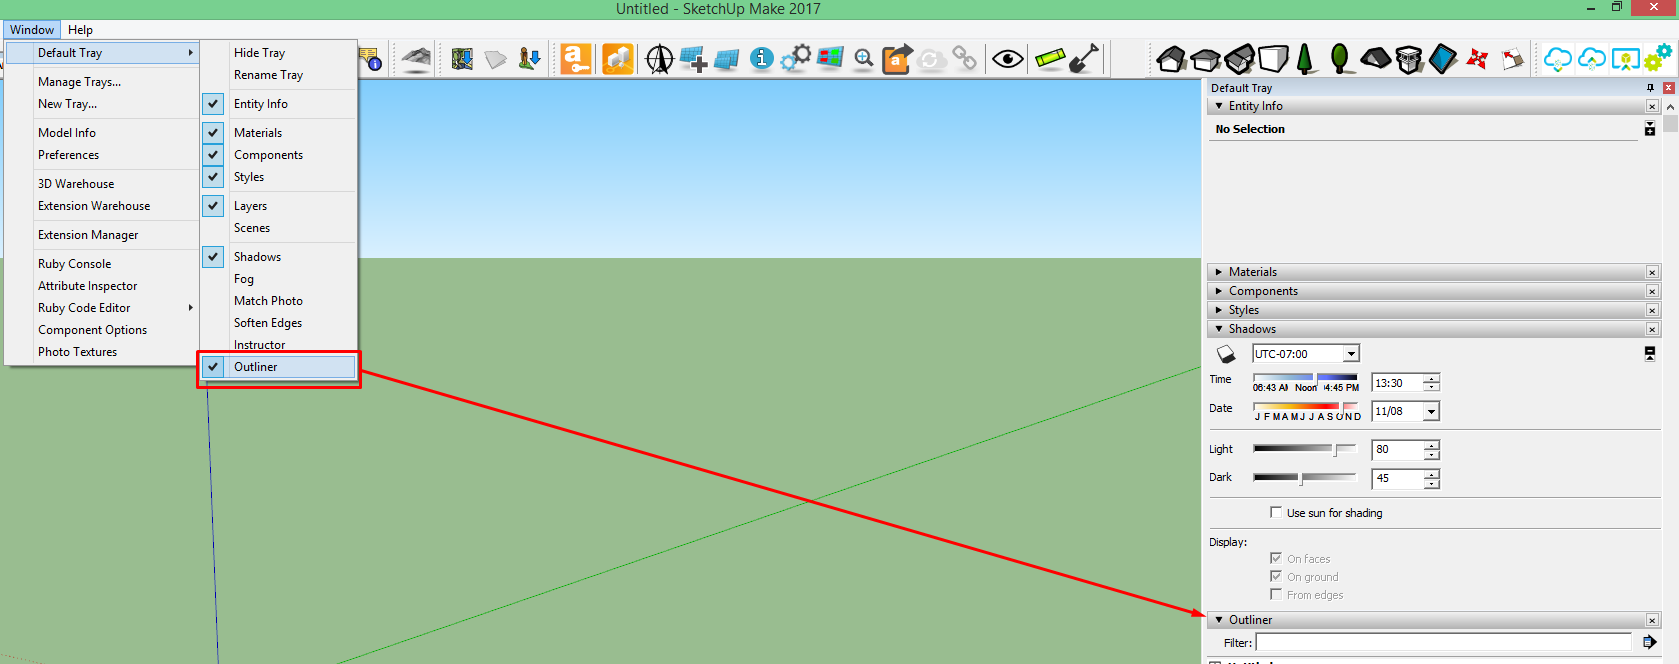
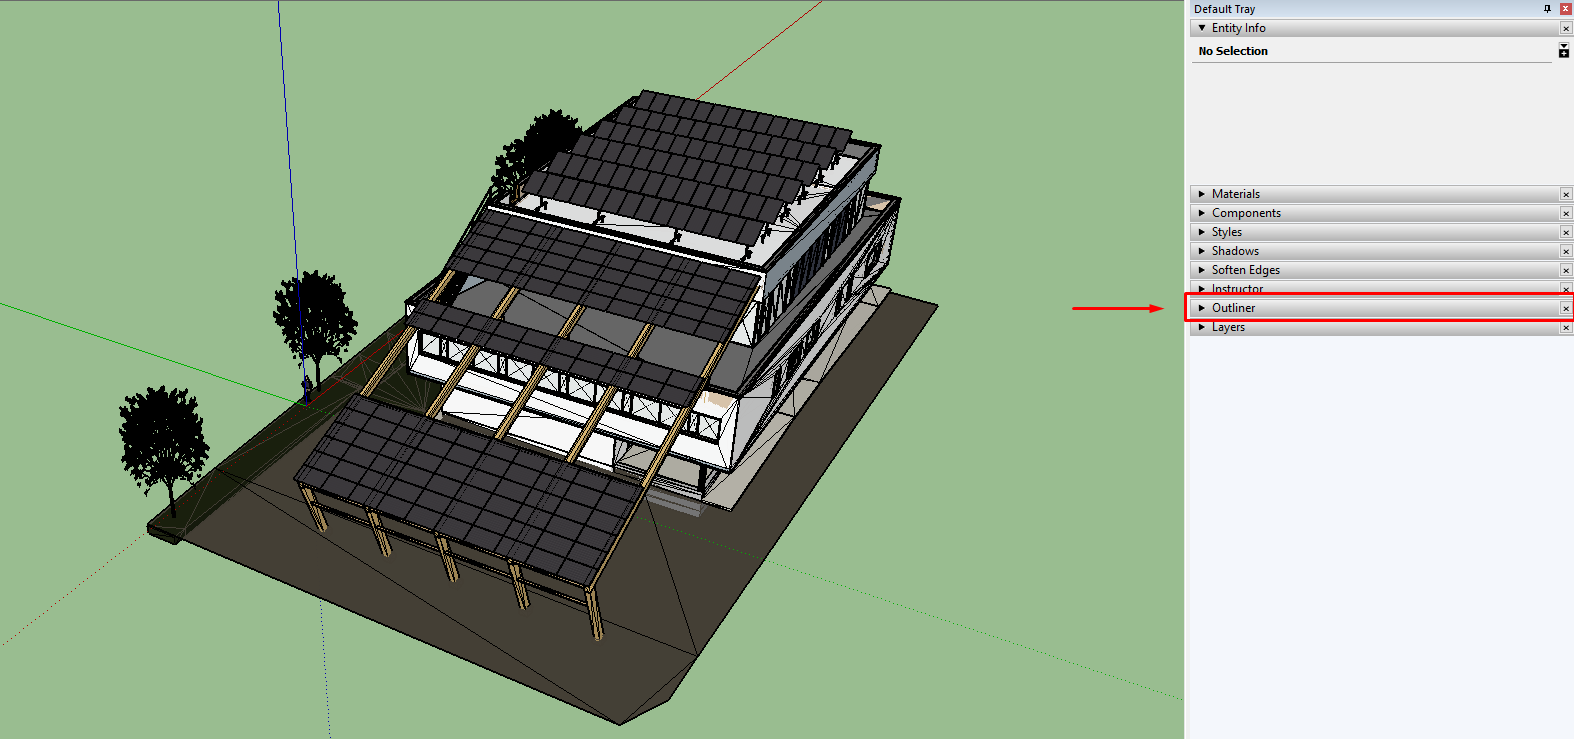
To display the 'Outliner' tab in SketchUp, open the 'Window' menu, select the 'Default tray' option and check the 'Outliner' checkbox
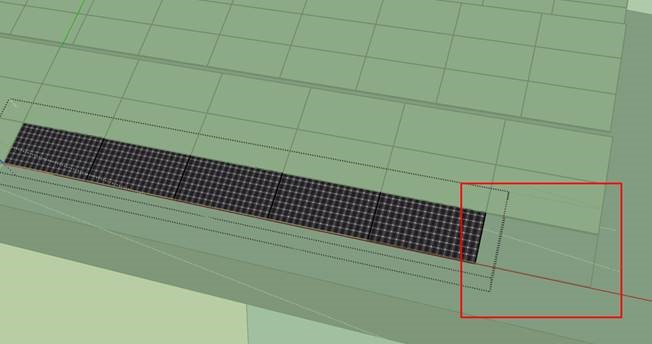
How do I delete a single PV module in a table? makeUniqueSU
For performance reasons, the replication creates an identical definition for all 'groupePV' elements.
If you want to change a table, you must make it unique first.
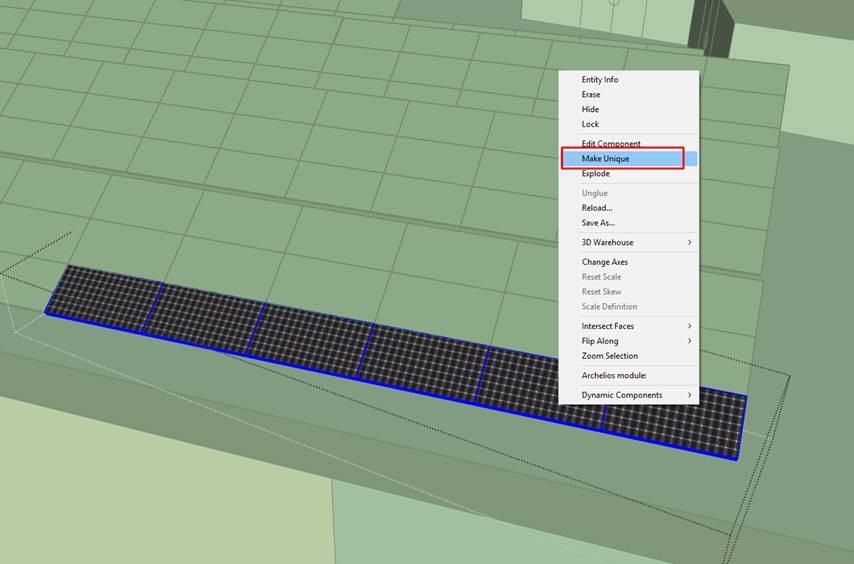
Then, delete the target module.
Click on the 'Synchronise changes' button to open the synchronisation window 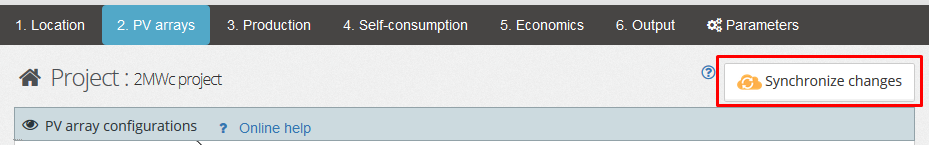
It allows you to edit the project in archelios, add inverters, and if necessary, go back to SketchUp to make changes. For instance, you can add any forgotten obstacles and remove them(e.g., when a tree was cut down). You can add or delete a module, redefine the layout and so on.
If your project is heavy, you can purge the unessential elements.
Refer to the FAQ: purgeFileSU
Also, make sure that the 'Outliner' is closed. If it is open, it will refresh with each action, and therefore, it will slow down SketchUp significantly. 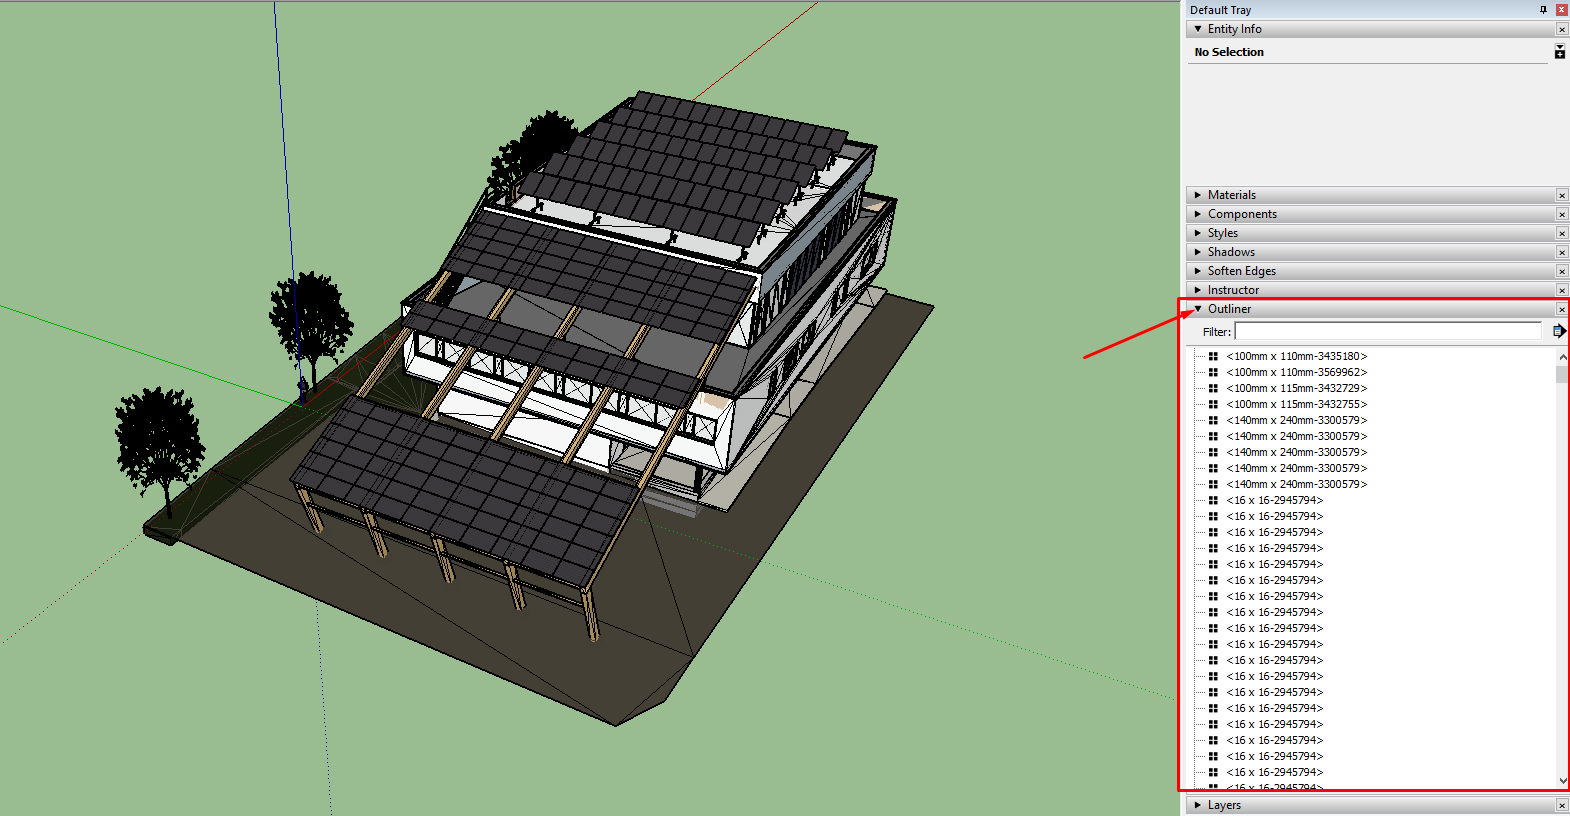
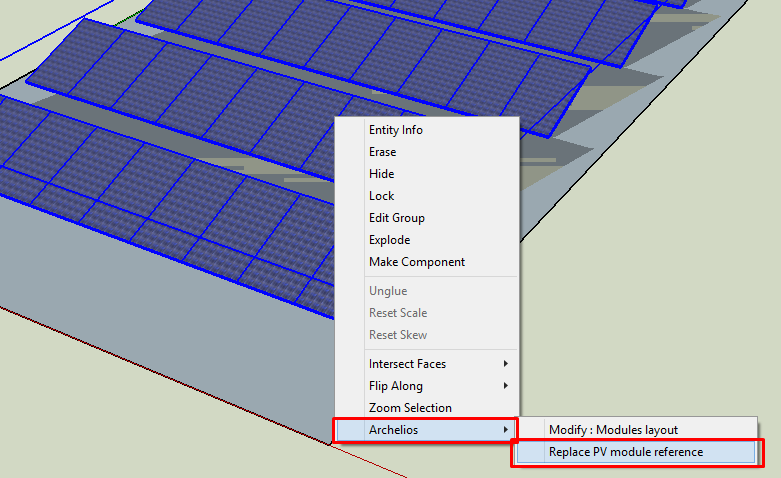
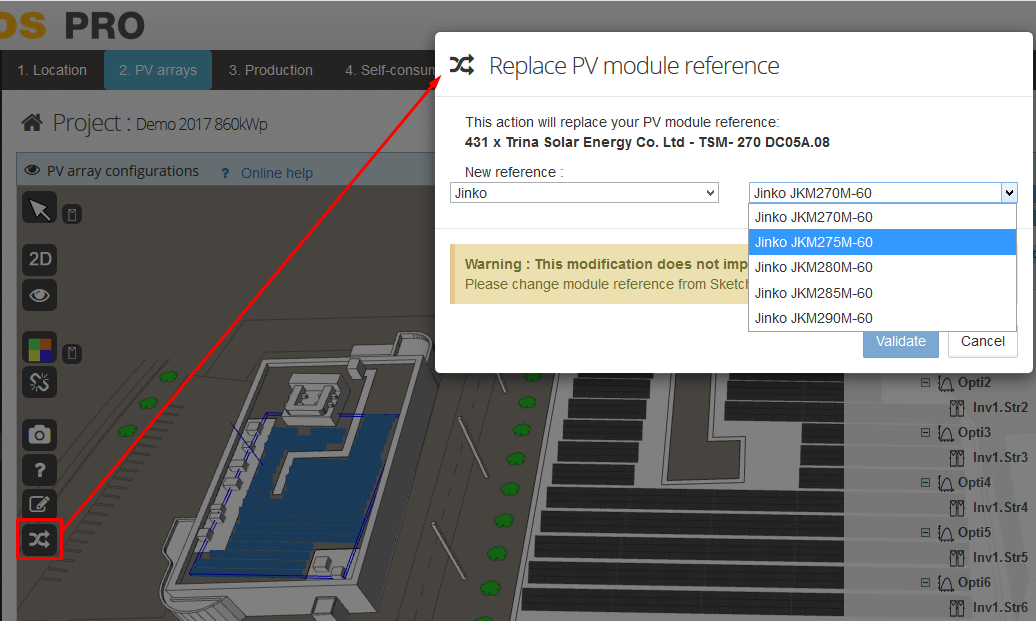
Can I change the module reference without having to repeat the duplication process? changeReferenceModuleSU
To change the module reference in SketchUp, please select one or more module groups, and click on 'Replace PV module reference' in the context menu.
The proposed modules are only those modules with the same dimensions as the module to be replaced
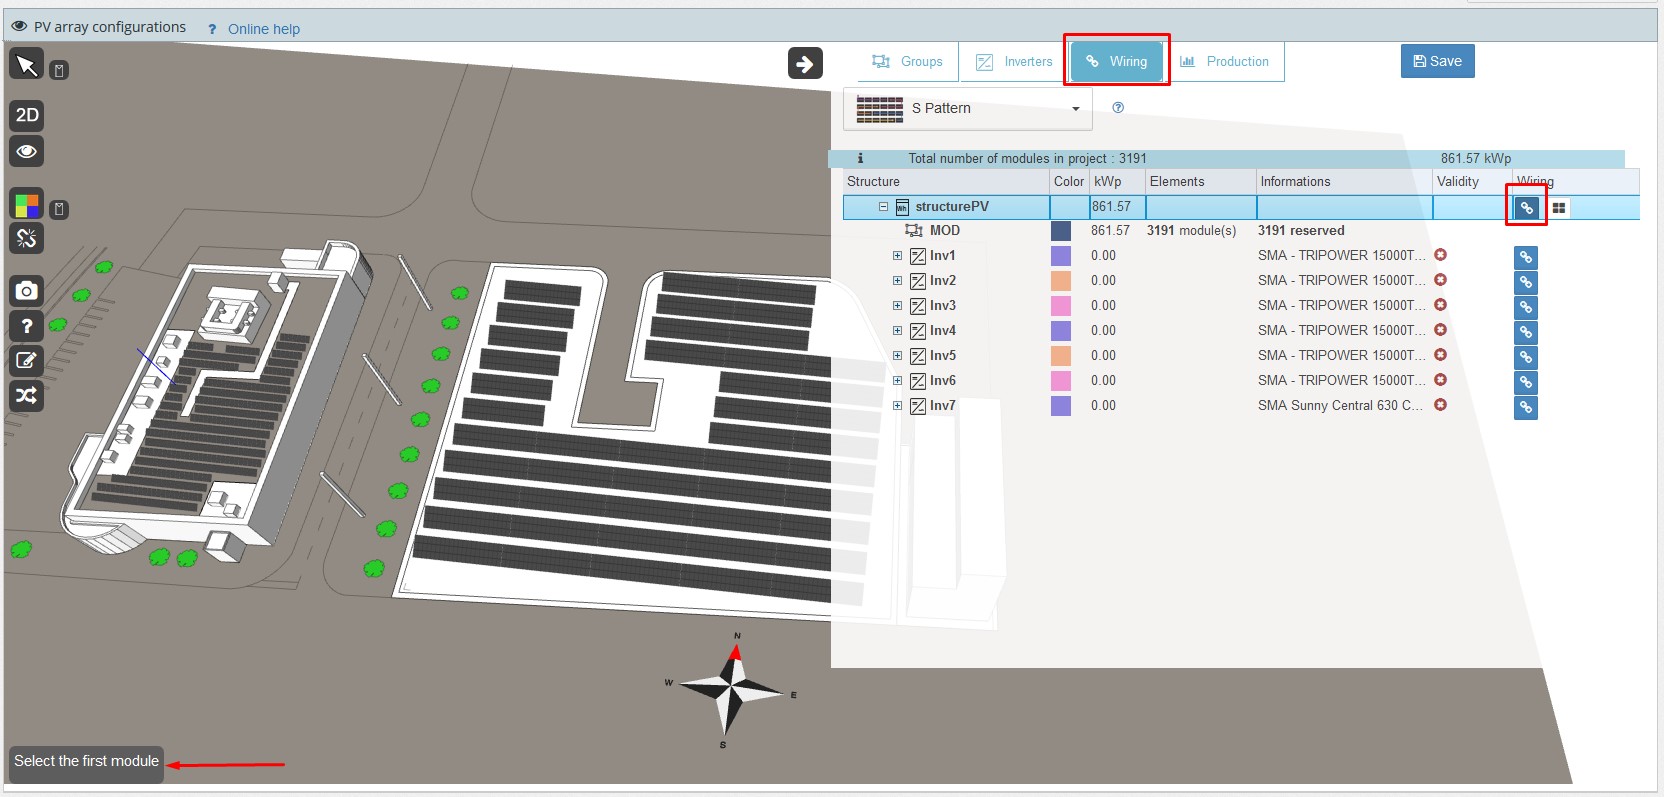
How do I wire my inverters and junction boxes? WiringInvertersAndCombinerBoxes
Click on the Wiring button from the archelios SketchUp plug-in
You must have previously chosen and wired the strings in archelios online and synchronised the changes 
The 'Total length of the integrated cables of a PV module' parameter corresponds to the length of the two cables (+ and -), which are included in a PV module.
In this case, the value will be 240 cm (= 120 x 2) 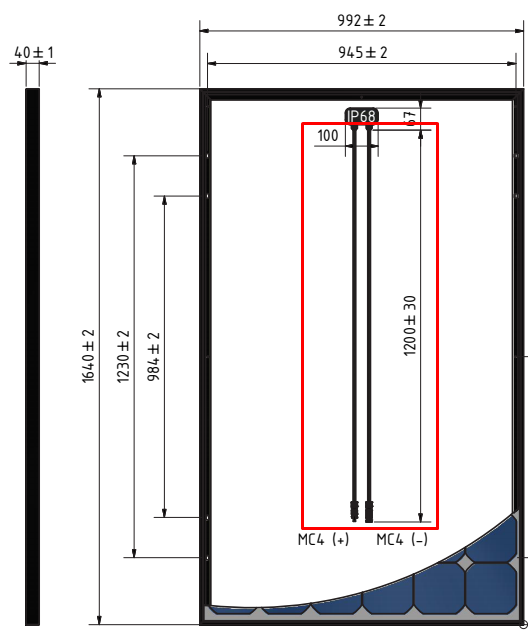
I've duplicated modules on a roof featuring chimney stacks, but the modules are overlapping the stacks overlappingModulesSU
To automatically calculate the spacing between rows, you must generate your project from our SketchUp plug-in.
When duplicating modules and after entering a module's tilt, you can press the 'Auto' button that corresponds to the spacing between rows (value A)
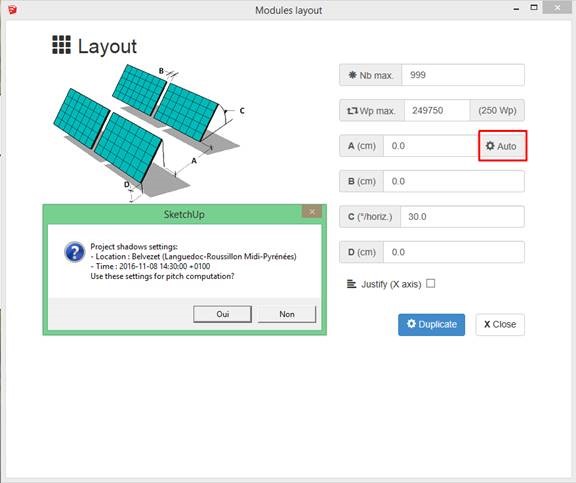
The value is automatically calculated based on the date and time settings in SketchUp:
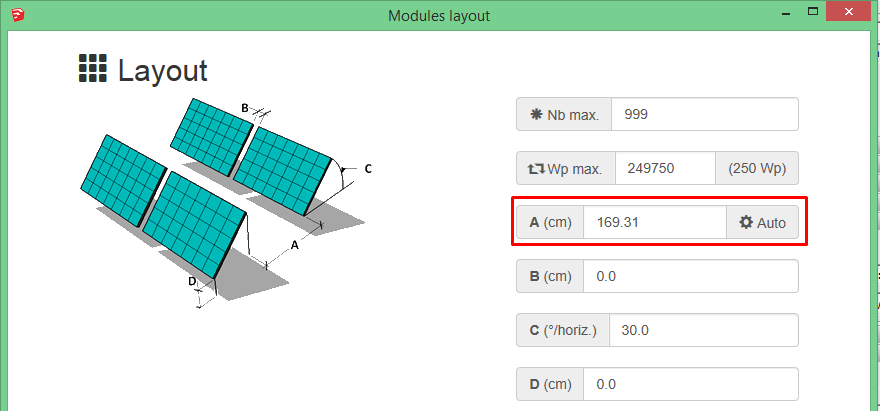
To change the date and time of the shading calculation for automatic spacing (e.g. put 21 December at 12 am for the winter solstice), use the 'Shadows' tool included in SketchUp
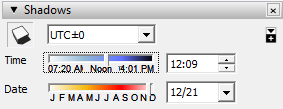
Which may change the value of A

This spacing is considered to be the minimum value between the rows to prevent modules from casting shadows over each other.
This feature automatically calculates the spacing required between each row to prevent one row from casting shadows over another.
This feature is useful for uneven ground. If the ground is flat, you are advised to use the 'Calculate A (static)' feature, which will calculate the minimum fixed spacing needed to prevent one row from casting shadows over another (the spacing is the same between each row).
To duplicate modules from SketchUp on the ground depending on the type
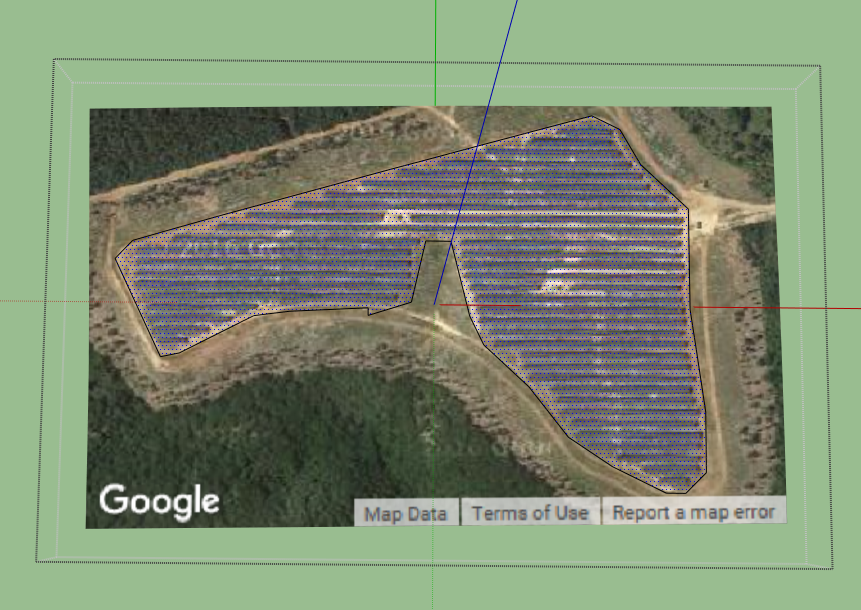
- Locate your project
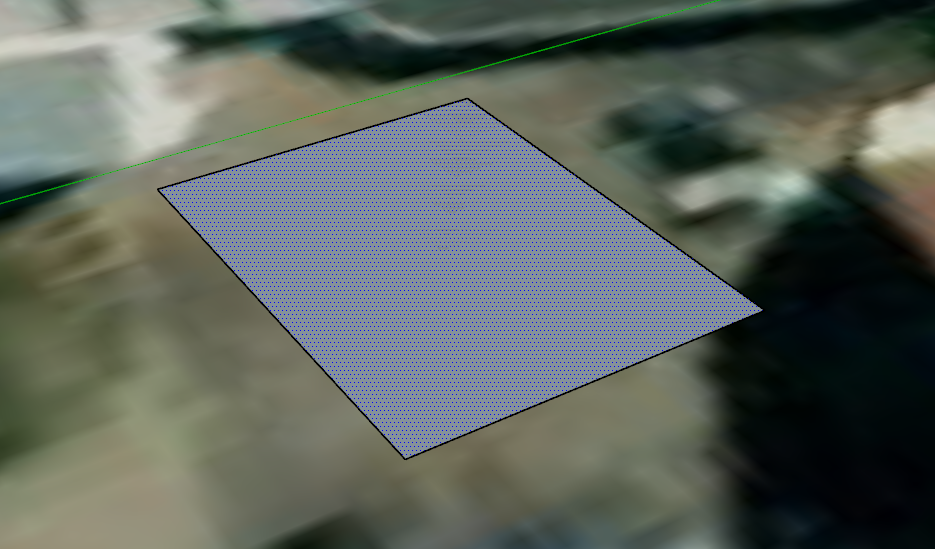
- Draw the outline of your area
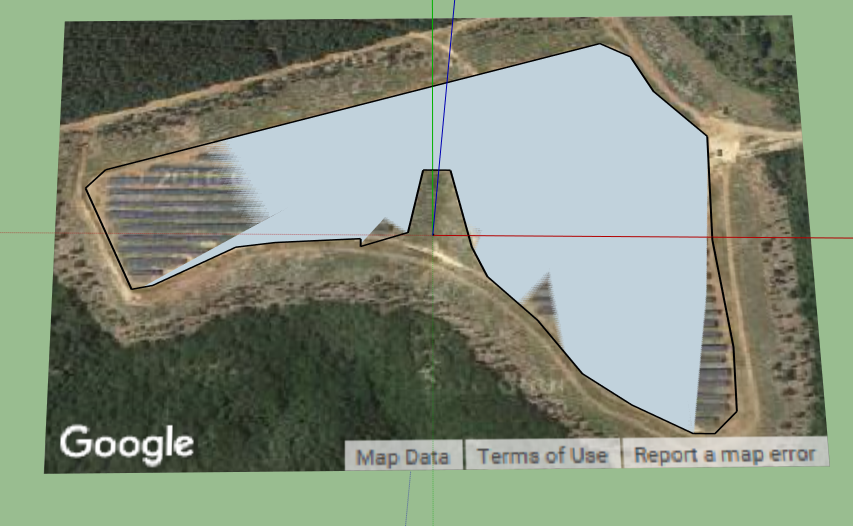
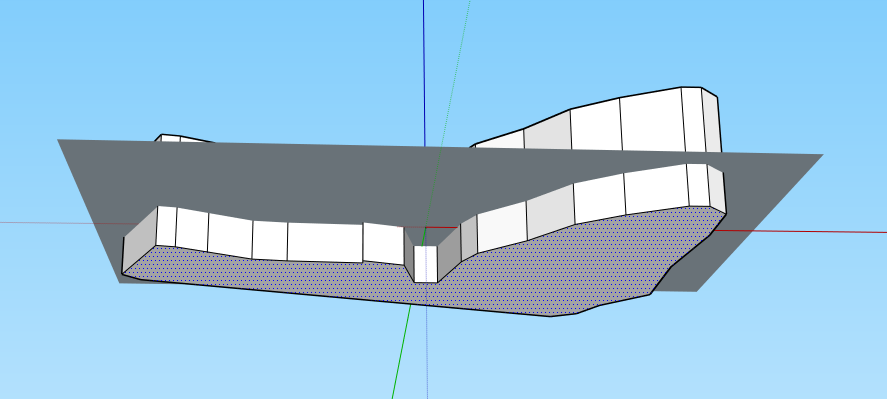
- Push and pull. Remember to let the volume exceed so that it covers the entire ground.
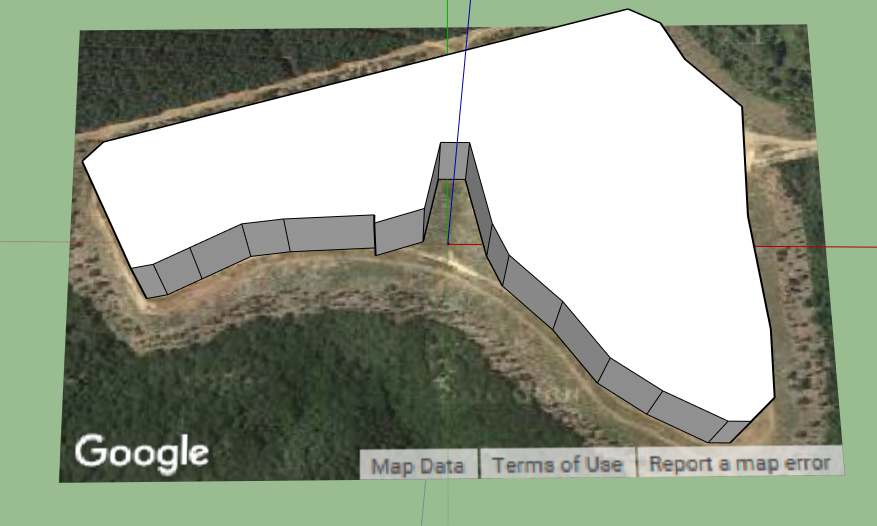
- Select the ground and activate it

- Unlock Ground Location (right-click)
- Triple-click on the ground and then right-click on the ground and choose:Intersect faces with model
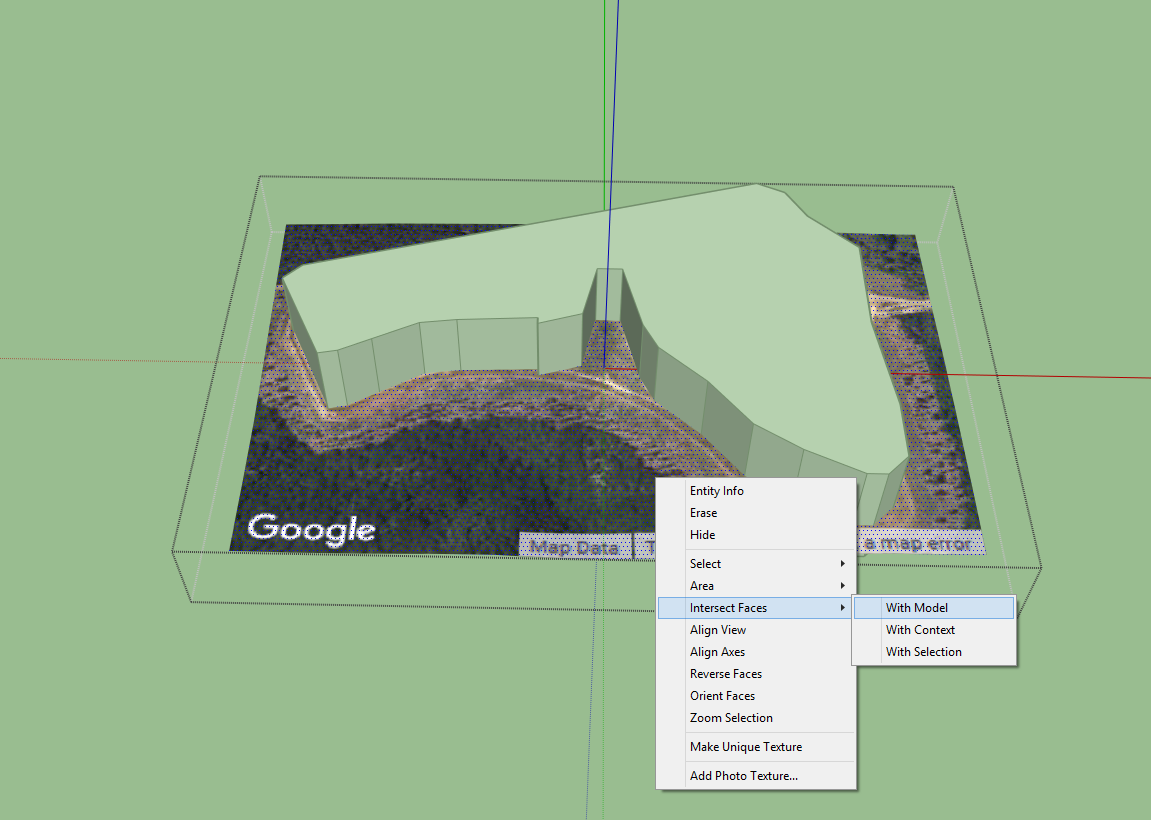
- Triple-click on the volume and then right-click on the volume and choose:Hide volume
I'd like to change the back face appearance of my modules in SketchUp. How do I do it? textureModuleSU
- Go to the 'Materials' tool
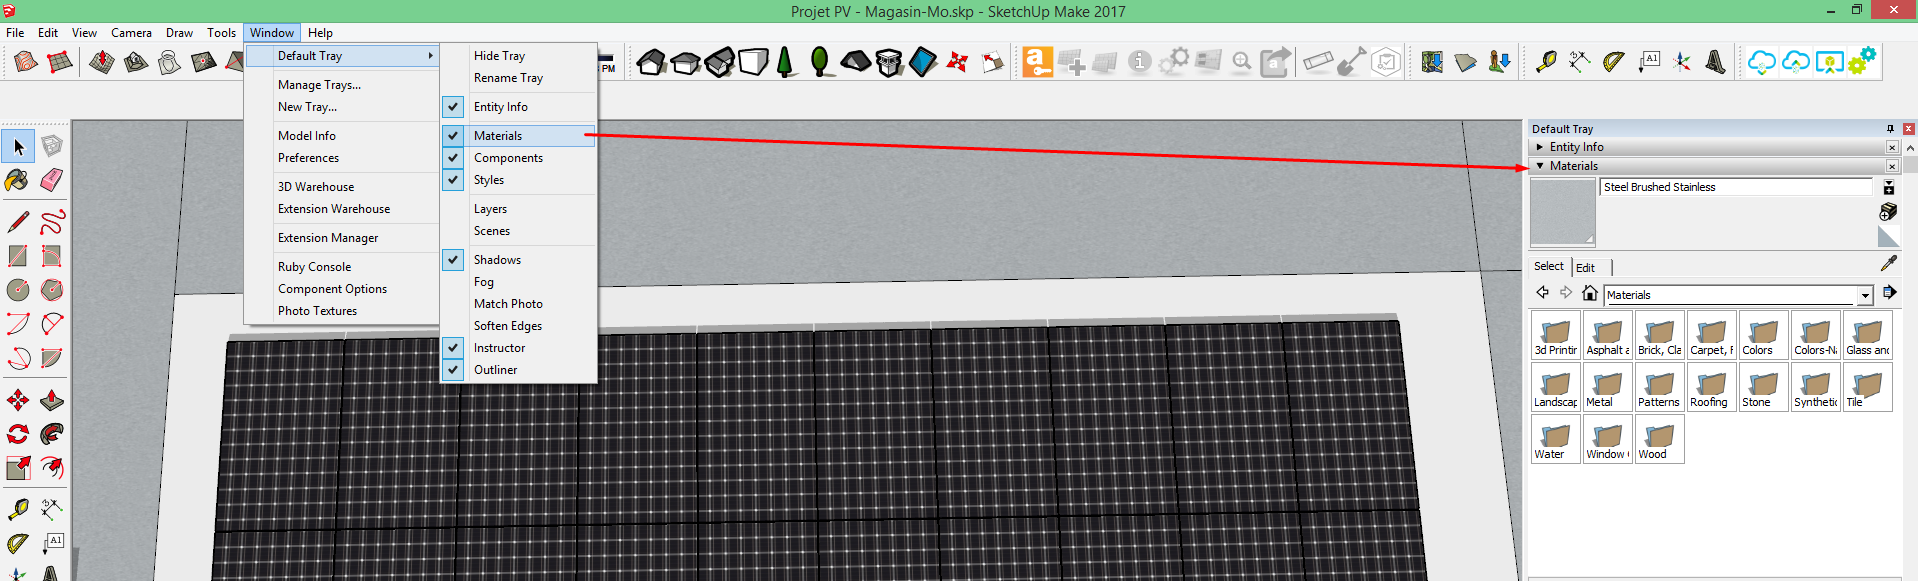
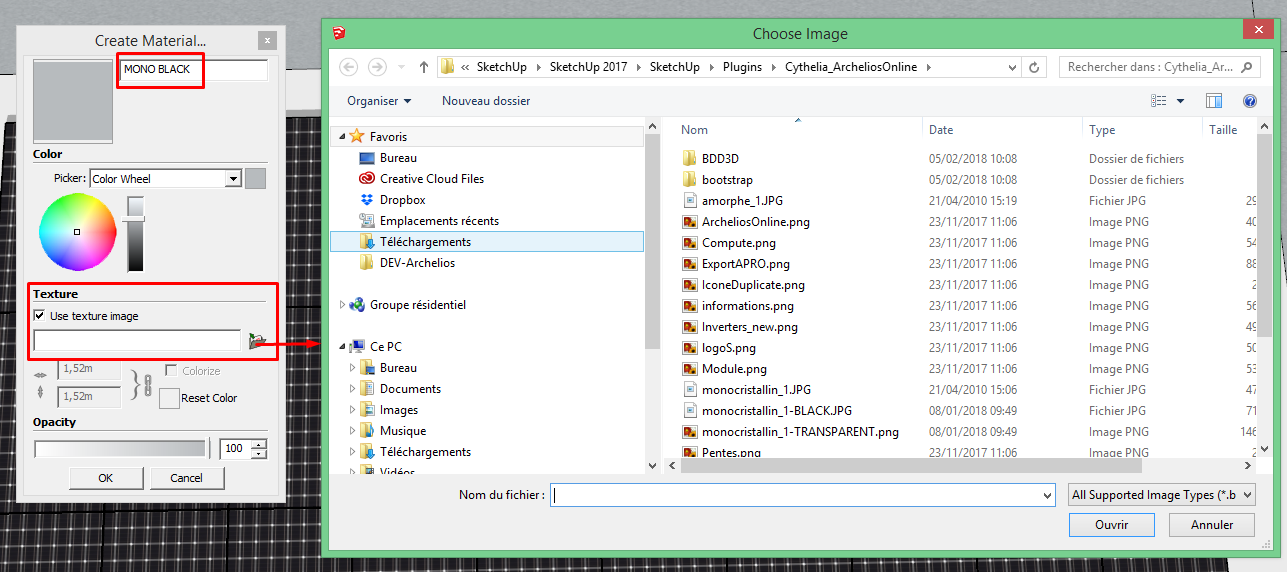
- Create a new material
Note that the name of the texture must begin with PV- to be recognised and applied in archelios PRO.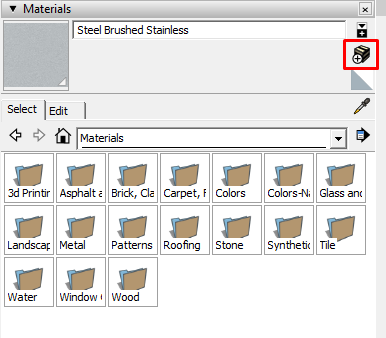
- Use a texture image and select it in the directory
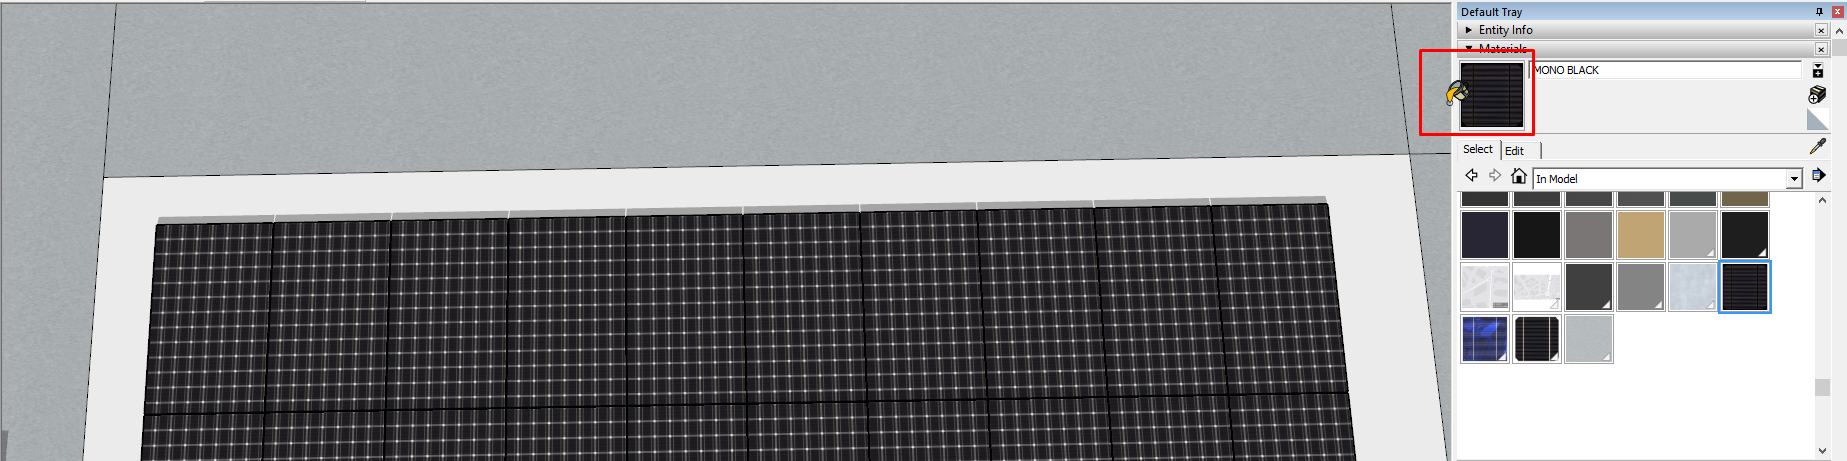
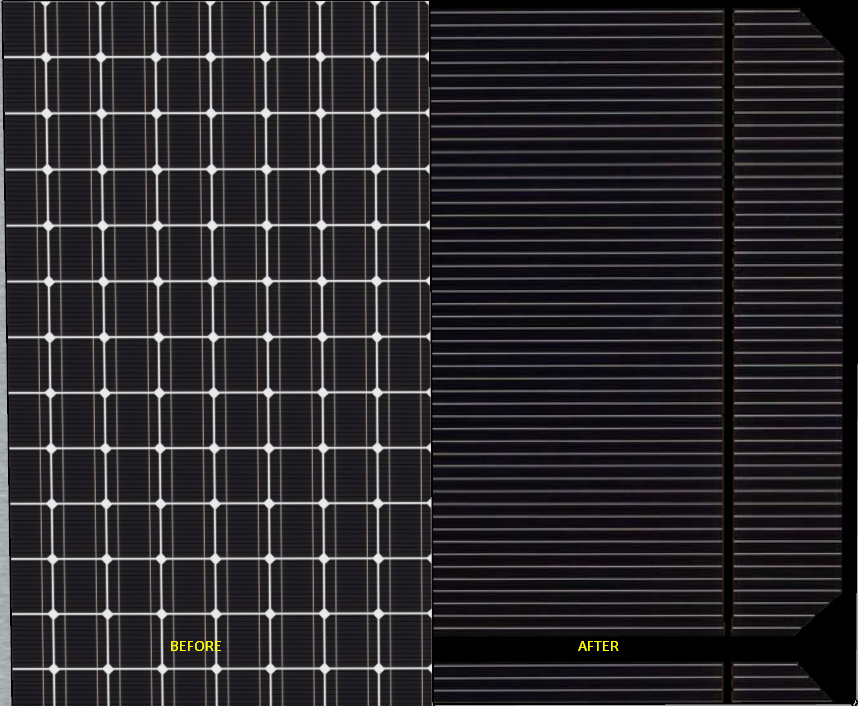
- Select the material and apply it to the modules
My previous project is no longer compatible after version 2021R1 for wiring. What can I do? oldStructurePVSU
You need to rewire the inverters by following these steps:
- Save a copy of your current SketchUp project
- Open the 'Outliner' tab (under the 'Window' menu) and delete the 'structurePV' group
Please note that the placement of the inverters will be lost

- Re-synchronise your project

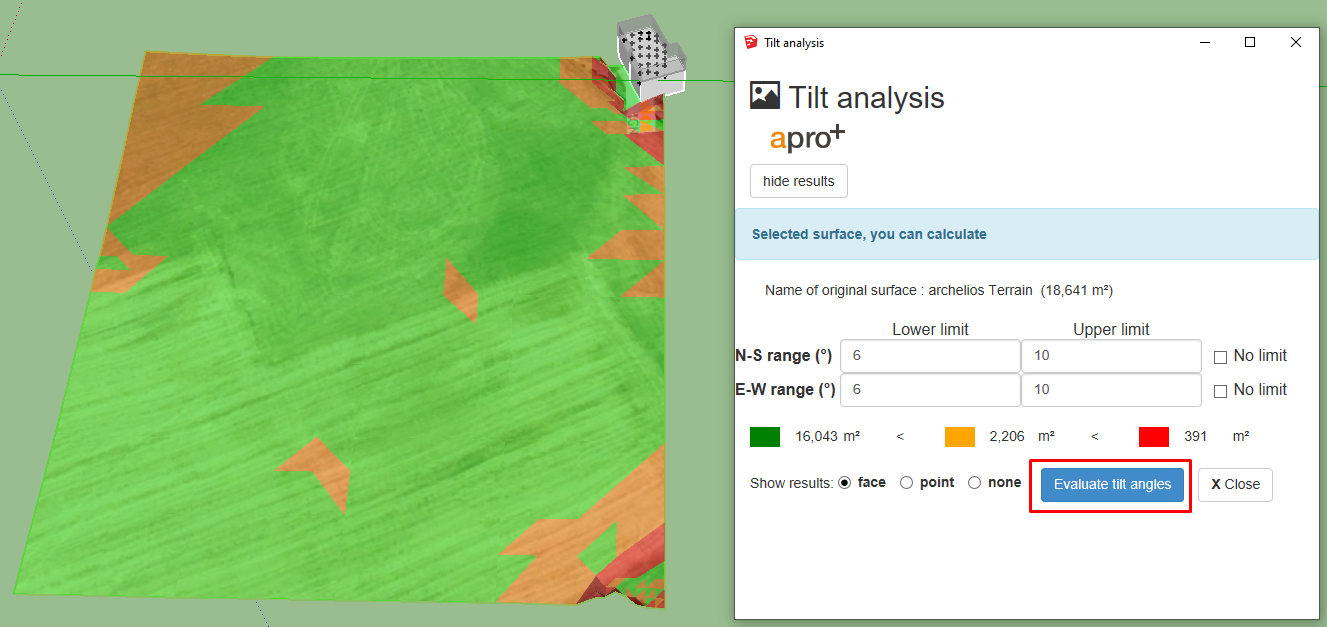
How can I determine the best place for installing my plant on the ground in relation to the relief of the terrain? slopesToolSU
You can get a clearer idea of your ground's slope so that you know the best position for installing your project.
You can use the 'Estimation of exploitable areas' tool accessible in the toolbar of the archelios PRO plug-in. 
- Import your terrain via SketchUp tools, our 3DMAP tool or any other means
- Select your ground
- Adjust the variables to suit your project. Anything before the lower bound is green, anything above the upper bound is red, and the rest is orange.
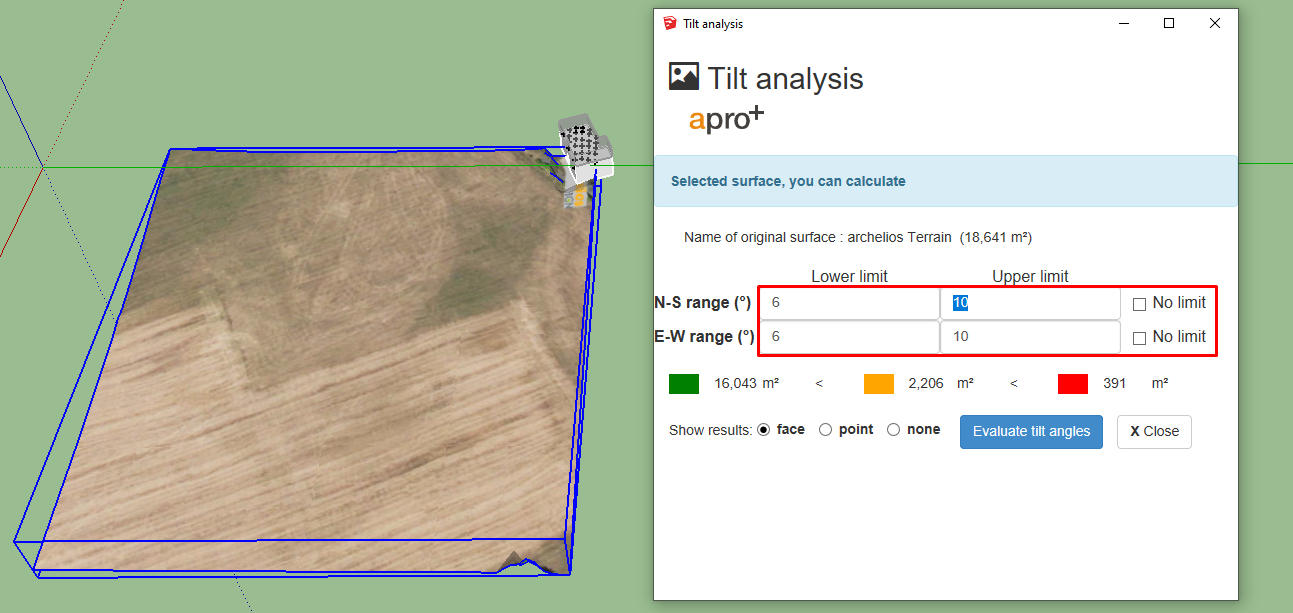
- Click on the calculation button to display the results.
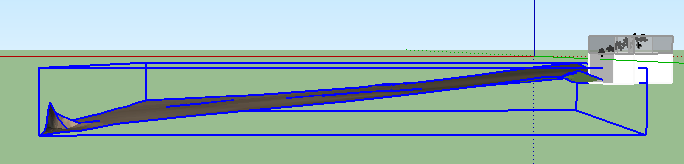
I would like to calculate the earthworks costs for a ground-based power plant. Can I do this with archelios PRO? earthMovingToolSU
Yes, this is possible with archelios PRO using the 'Calculation of volumes for earthworks' tool. 
You can watch our video on YouTube: https://www.youtube.com/watch?v=7-mxCwwyEQM
You will need two surfaces: one representing the original ground and the other representing the final ground (required ground).
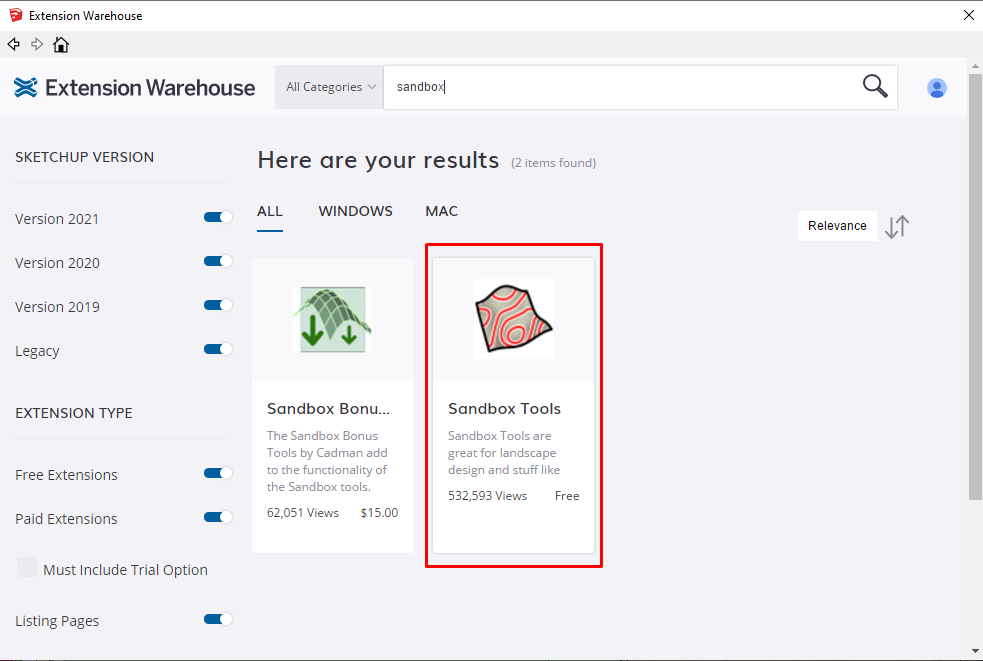
The final ground can be imported (if you already have it) or created with the 'Sandbox' tool.
- Place the final ground in the required position
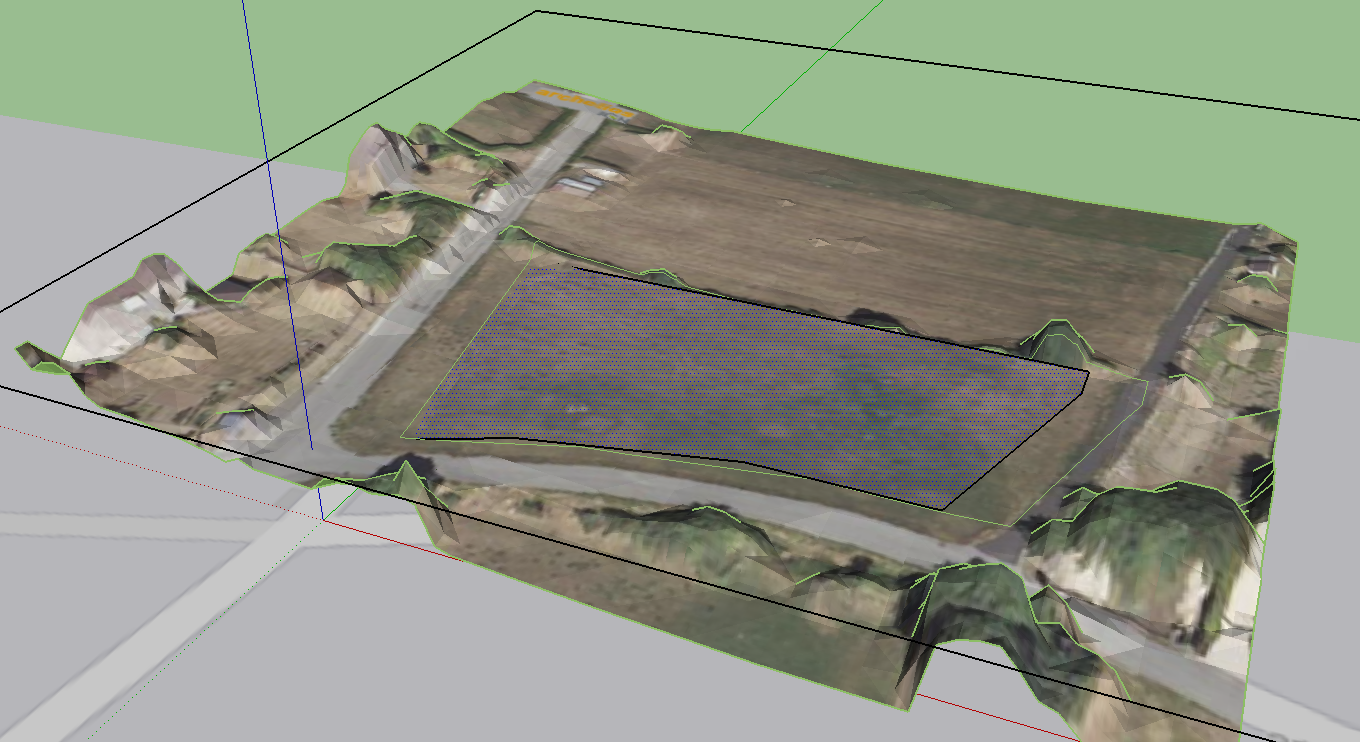
- Click on the 'Calculation of volumes for earthworks' tool and follow the instructions (select the original area and then the final area)
- Fill in the depth and cost parameters for the different layers
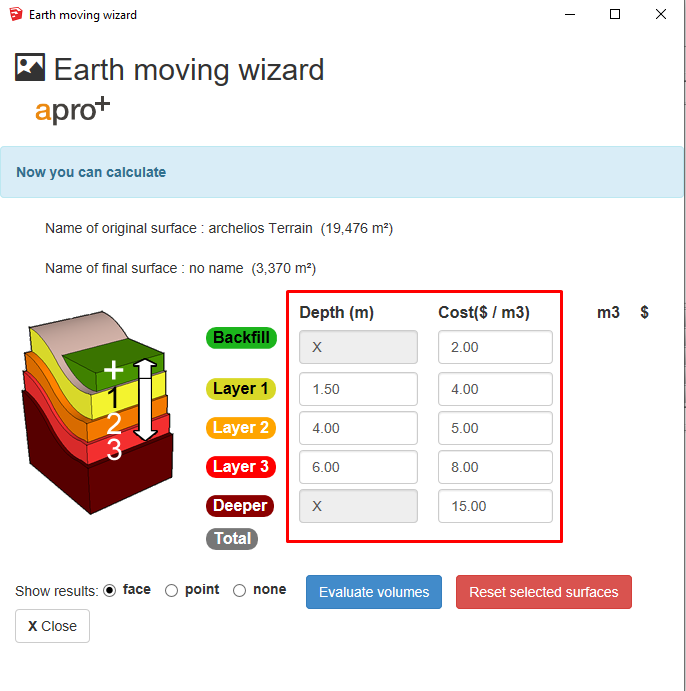
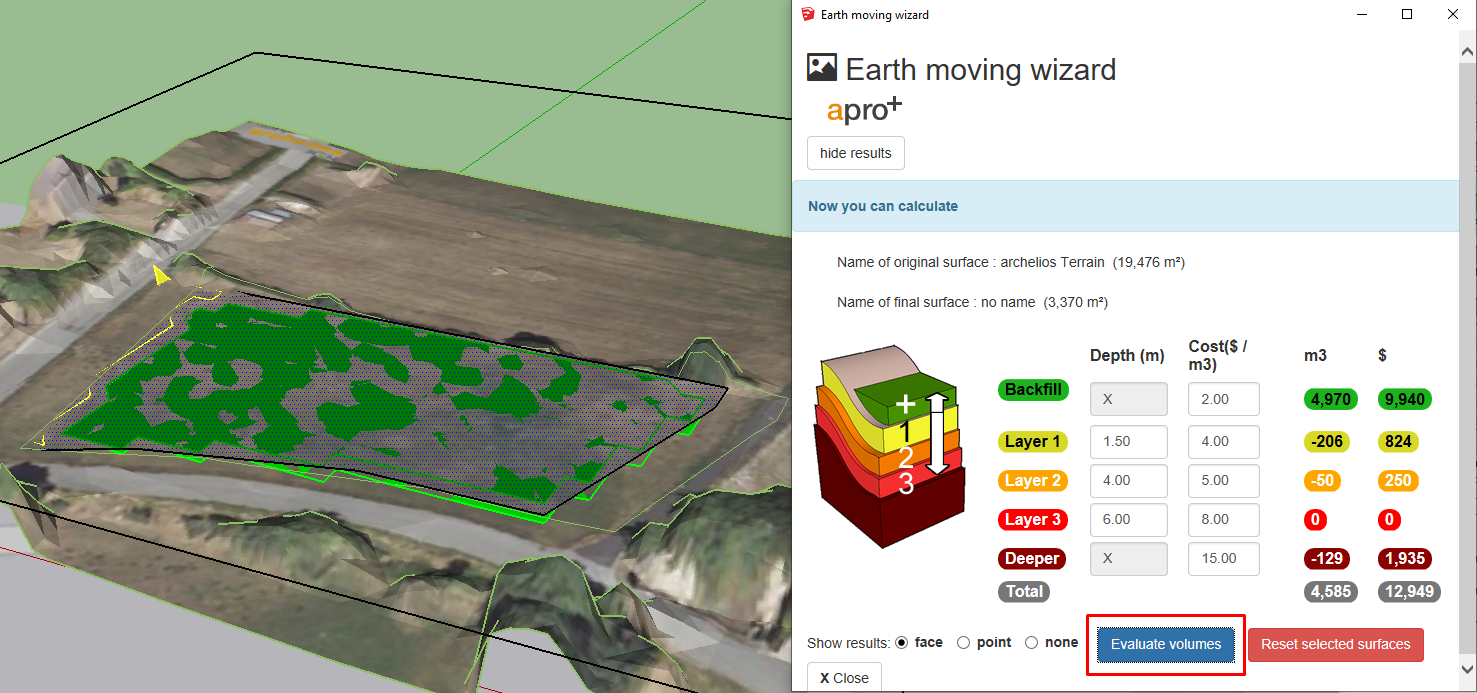
- Click on the 'Evaluate volumes' button to see the results
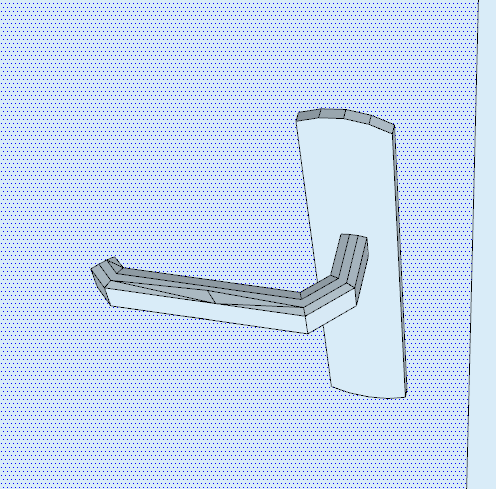
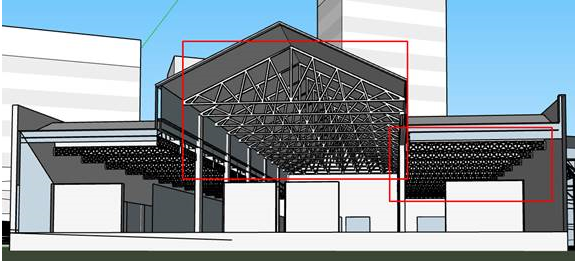
The problem may come from the level of detail on the file.
Archelios PRO calculates the shading for each module by reviewing all the edges and faces of the project that will be transferred when switching from SketchUp to Archelios PRO.
Therefore, you are advised to generate a light file by removing all heavy and unnecessary elements (for Archelios PRO from SketchUp) that do not cast shadows on the modules. It reduces the time required to switch from SketchUp to Archelios PRO online, the time needed to calculate shading and production, and the time to save the project.
E.g.: the doors, handles, adjacent buildings, structures inside buildings, etc.
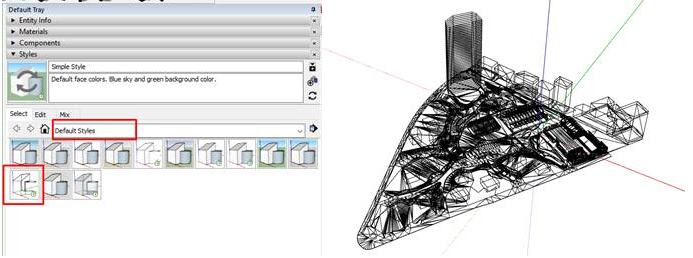
The environment may contain a lot of edges, which you can see by changing the style
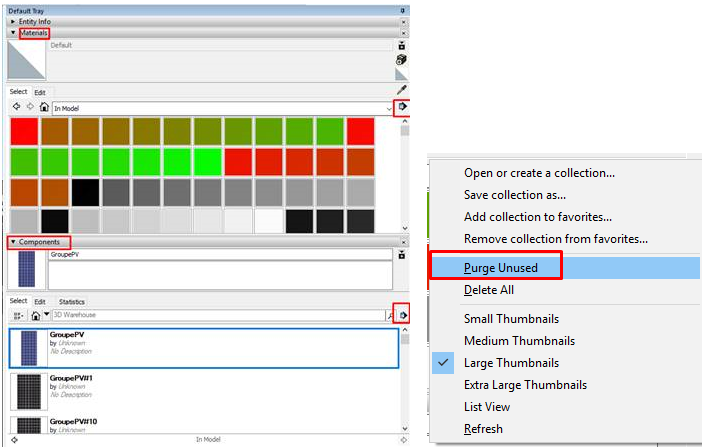
You can also purge all unused components and materials
Revit
How do you update Archelios pro-plug-in on Revit? updatePluginRevit
First of all, you must download the new version of the archelios PRO plugin in your online account
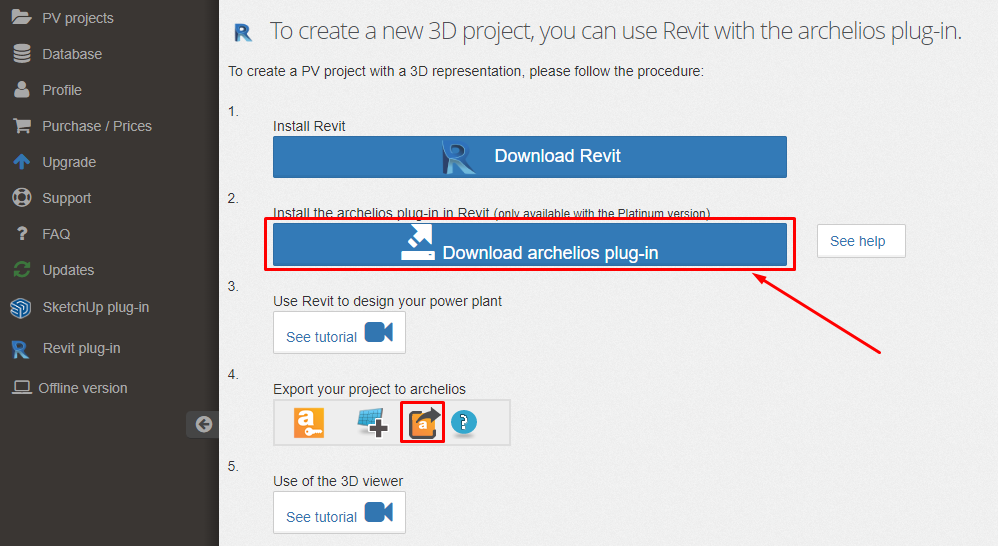
Then, double-click on the .exe file and follow the setup wizard.
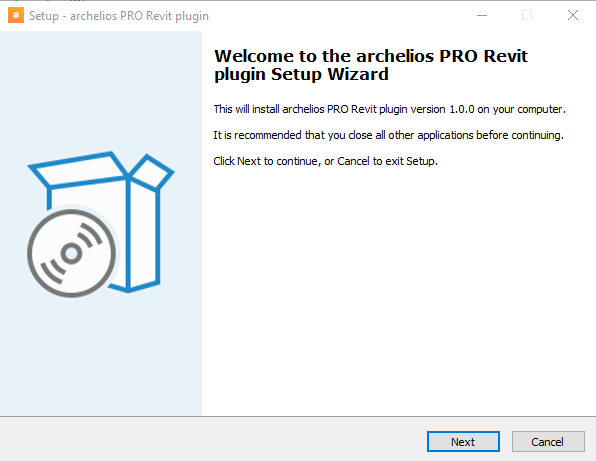
Finally, restart Revit to access Archelios PRO features.
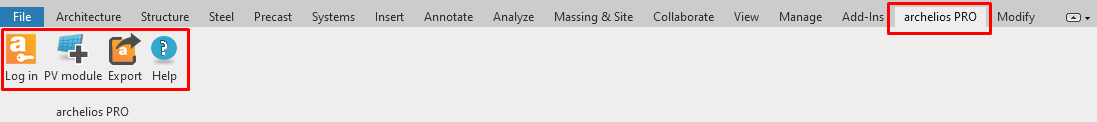
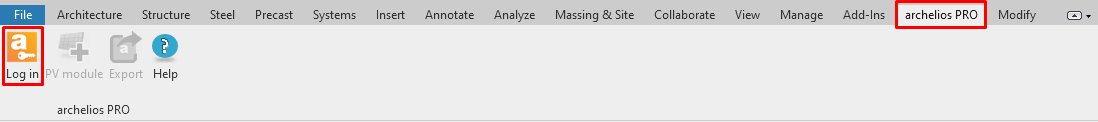
How do you use the archelios PRO plugin from Revit? usePluginRevit
You can watch our video on YouTube: Click here
Click on the 'archelios PRO' menu and then 'Log In'
Choose the required PV module

The PV module family can be found in 'Specialty equipment'.
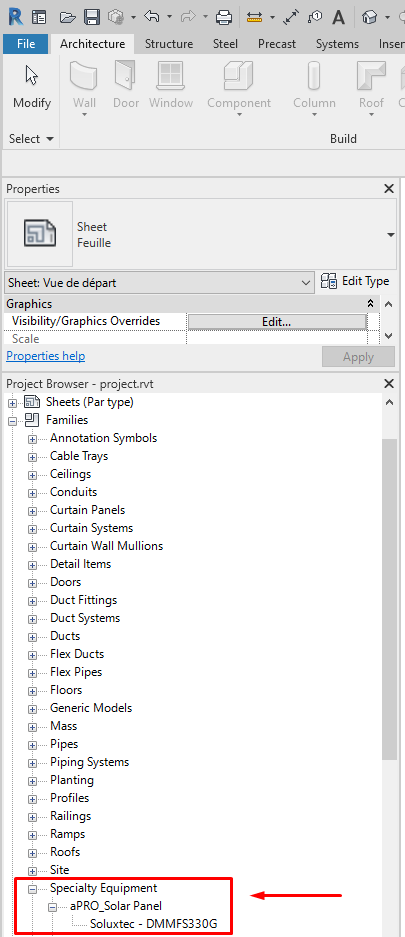
Then duplicate the PV module in the project.
To duplicate, select the 3D view to make the changes.

Use the 'Array' tool in the 'Modify' menu to quickly and easily duplicate PV modules:
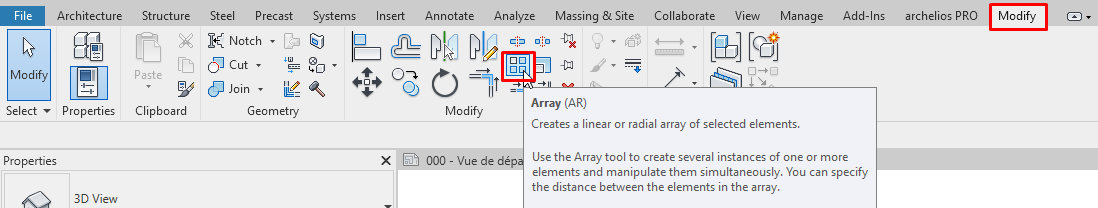
Link to the Revit video for using the 'Array' tool
Once the project is finished, export it by clicking on the export button to transfer the project to archelios PRO.

How to layout tilted PV modules on flat roof in Revit? tiltedModulesRevit
You can watch our video on YouTube: Click here
My project takes a long time to export itself. How can I shorten the export time? hideBeforeExportRevit
Revit projects contain a lot of information and therefore take a long time to export themself as they are.
You should know that beyond the export, exporting a project that is too detailed can slow down the calculation on archelios PRO, as well as the opening and saving of the project.
To maintain the integrity of the project on Revit, we recommend making invisible all the unnecessary elements for the calculation of irradiation. In particular, everything inside the buildings and the elements that do not cast a shadow (such as cars, water tanks, foundations, etc).
Despite the uselessness of those elements, they are taking up calculation time and space within the project.
To make certain elements invisible :
Click on 'Visibility/Graphics' button in 'View' tab

Uncheck all categories that are not necessary for archelios PRO
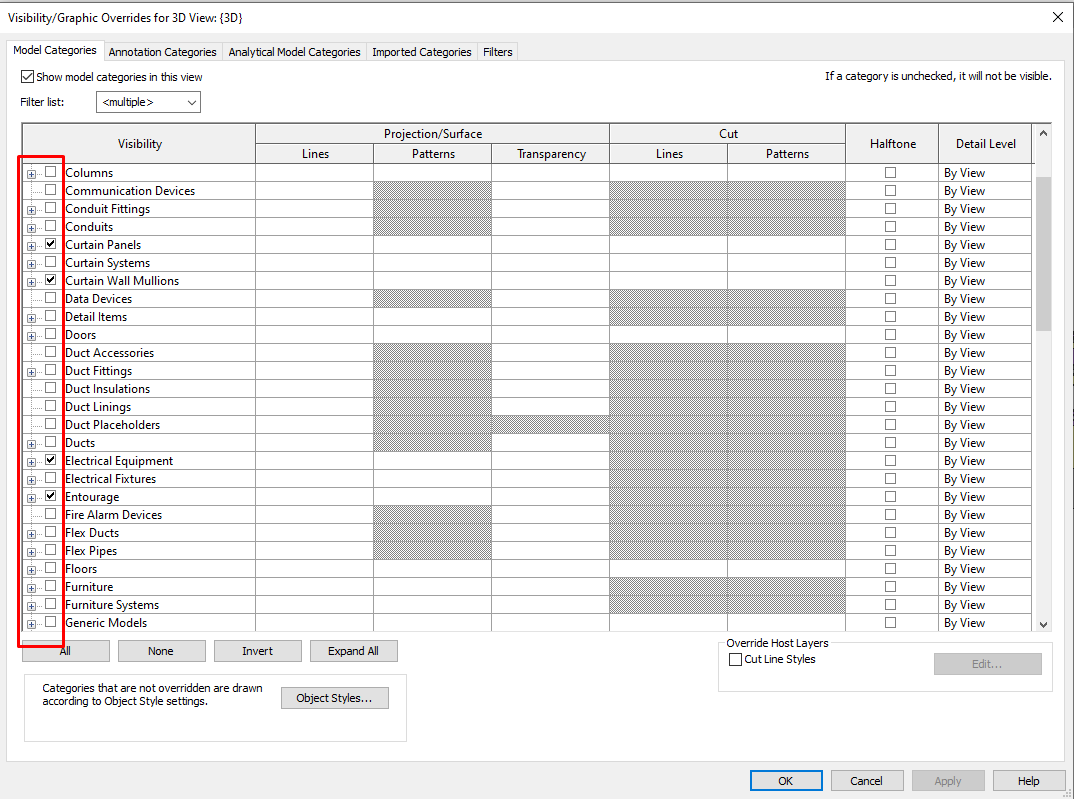
Click on 'Apply'
It is also possible to right click on an element and hide this element only or hide the whole category 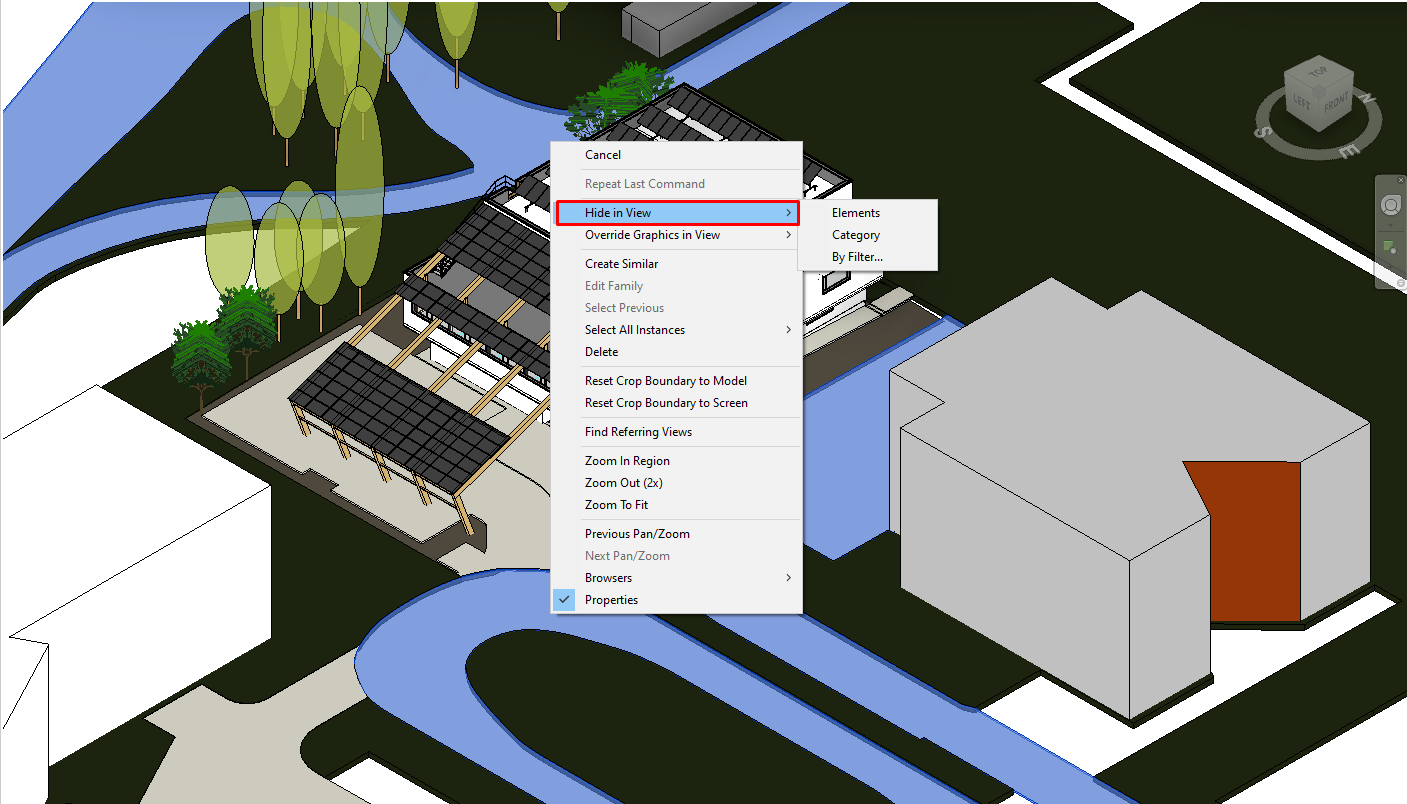
Your project is ready to be exported.
- Visit the K2 Base website and create an account : K2 Base
-
The creation of the project on K2 Base.:
-
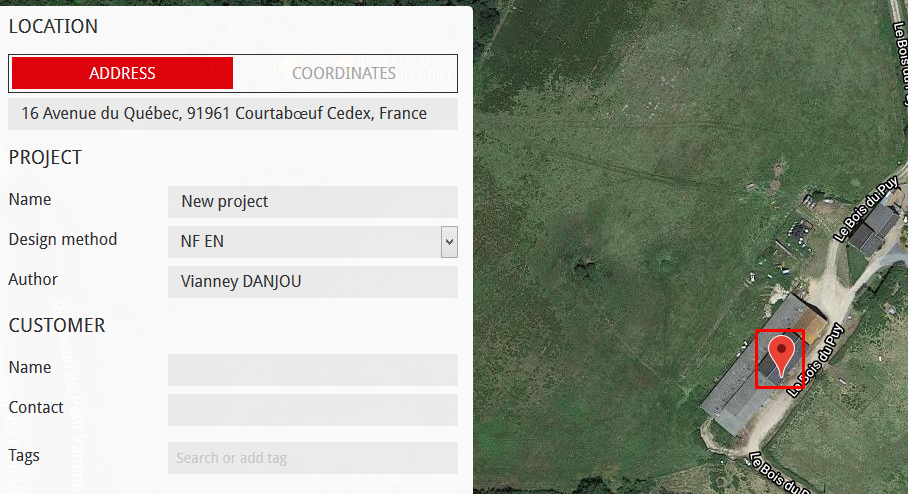
Define the location :
-
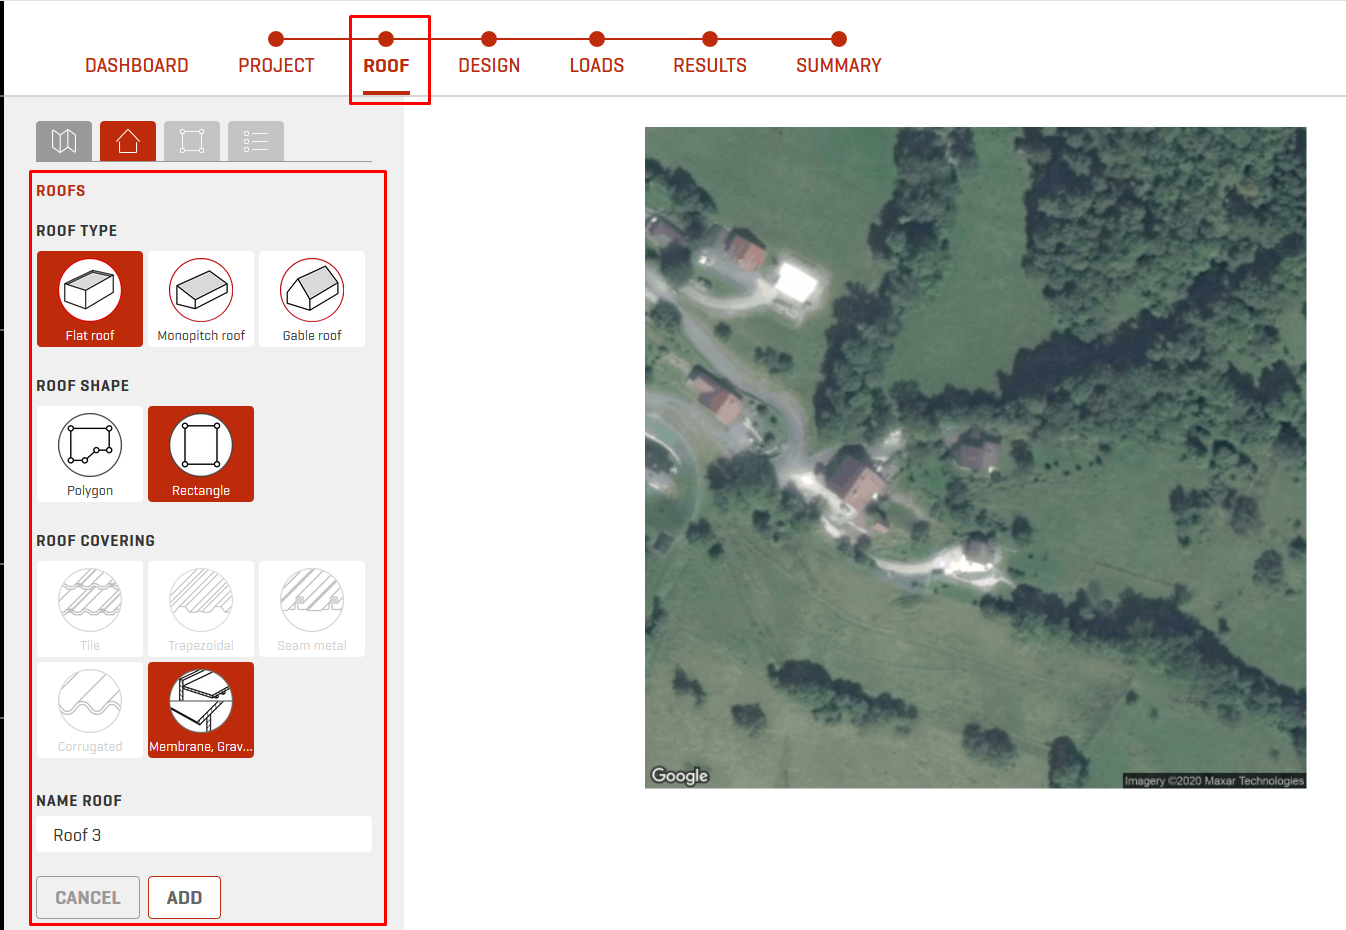
Add a roof :
-
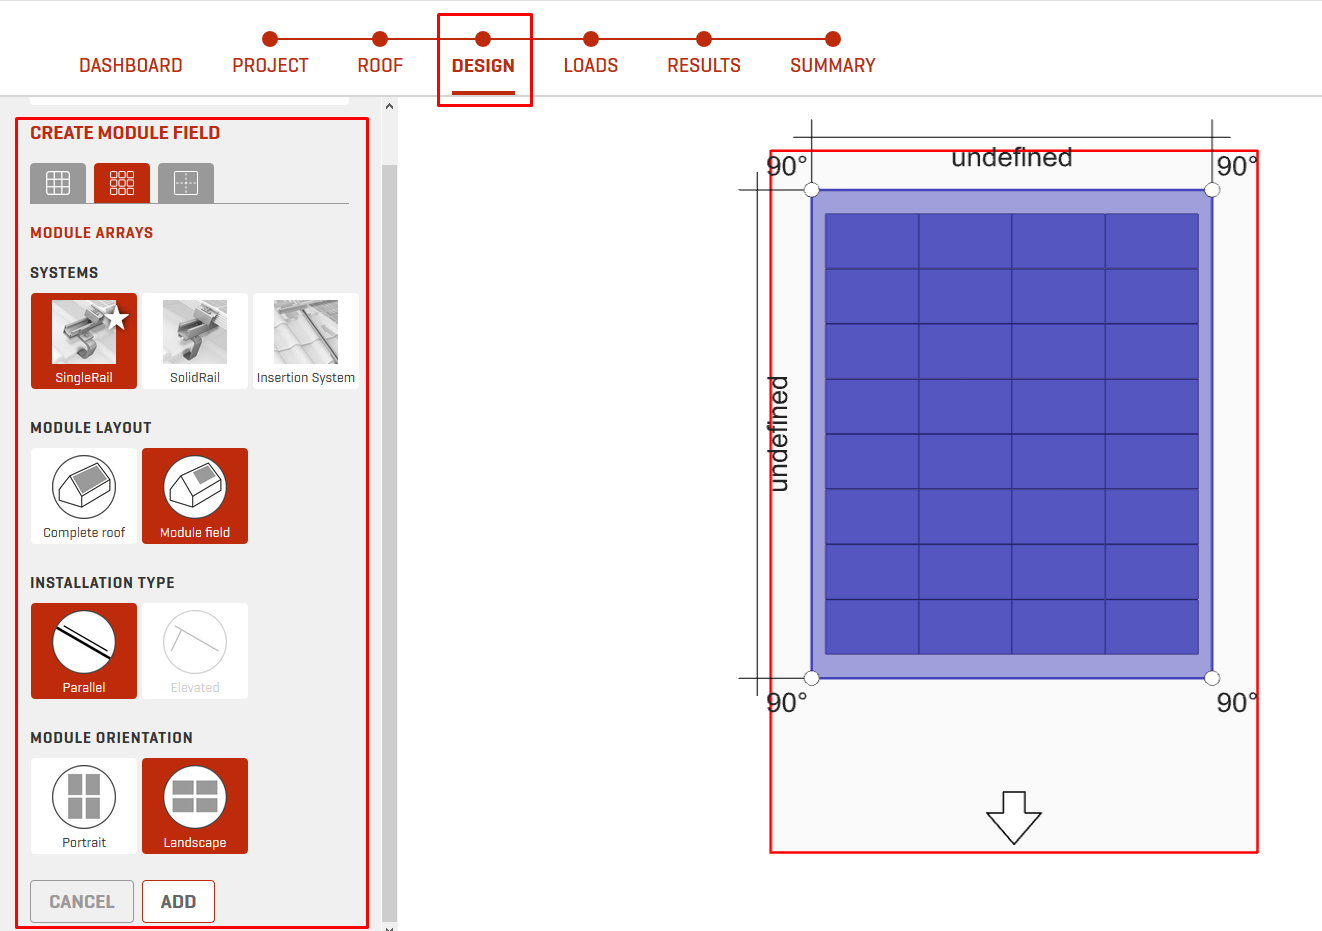
Define a module array :
-
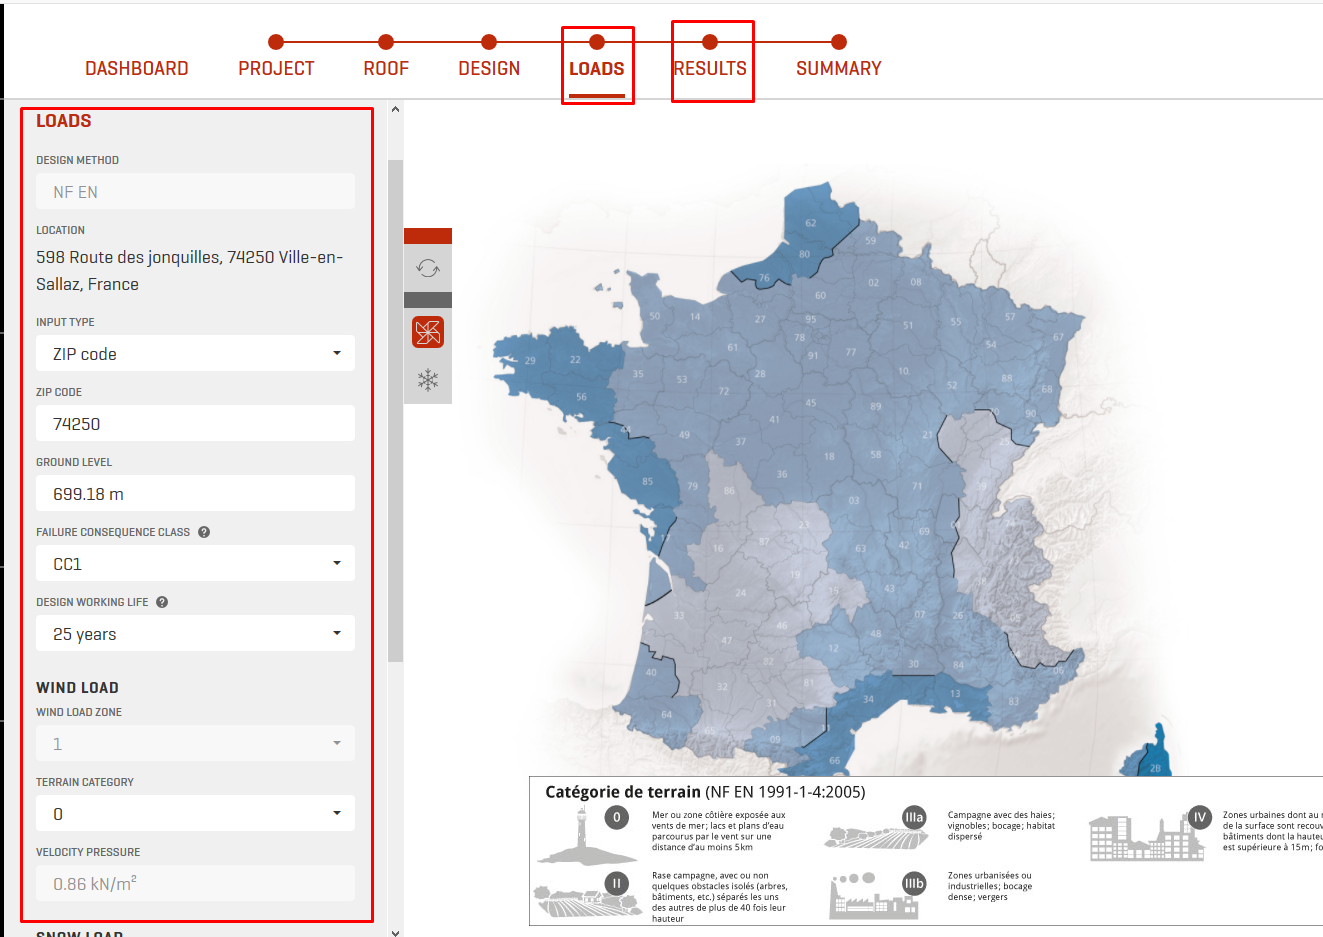
Fill in the load parameters and view the results
-
Define the location :
-
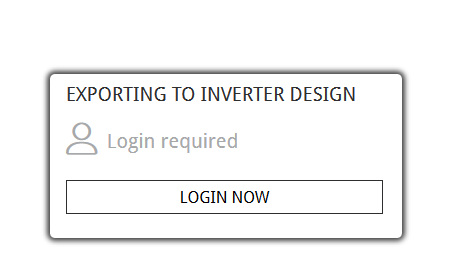
The export of the project to archelios Pro. :
-
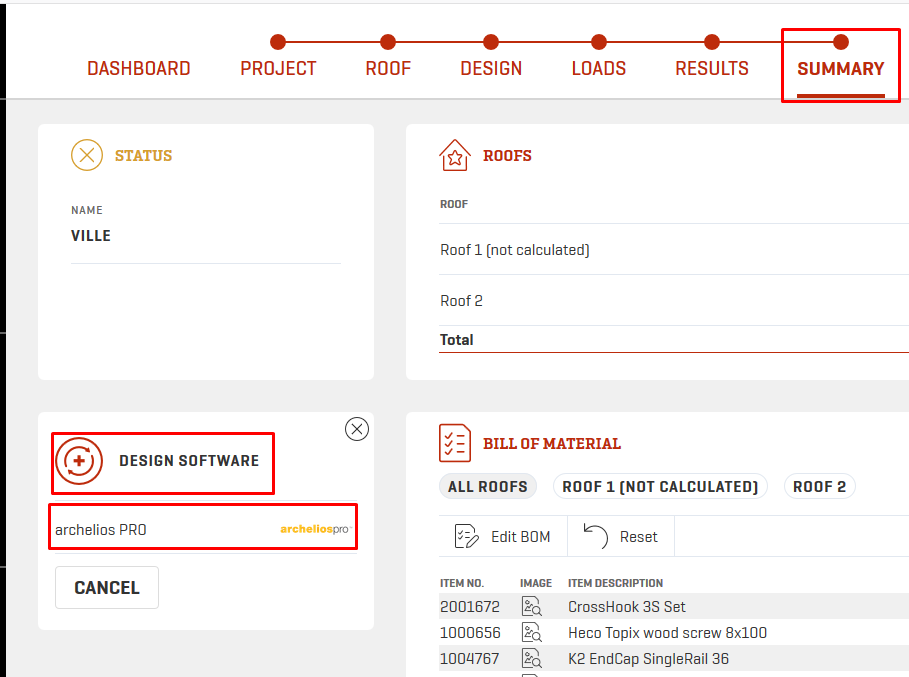
From the summary, select archelios PRO in the design software panel :
-
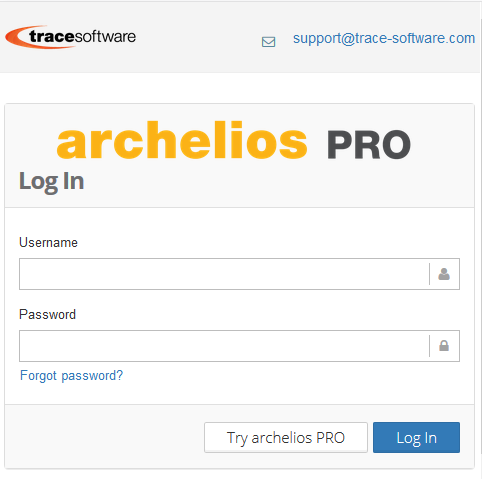
Log in to archelios PRO :
Once the export is complete, the project will be open and added to archelios PRO
-
From the summary, select archelios PRO in the design software panel :
-
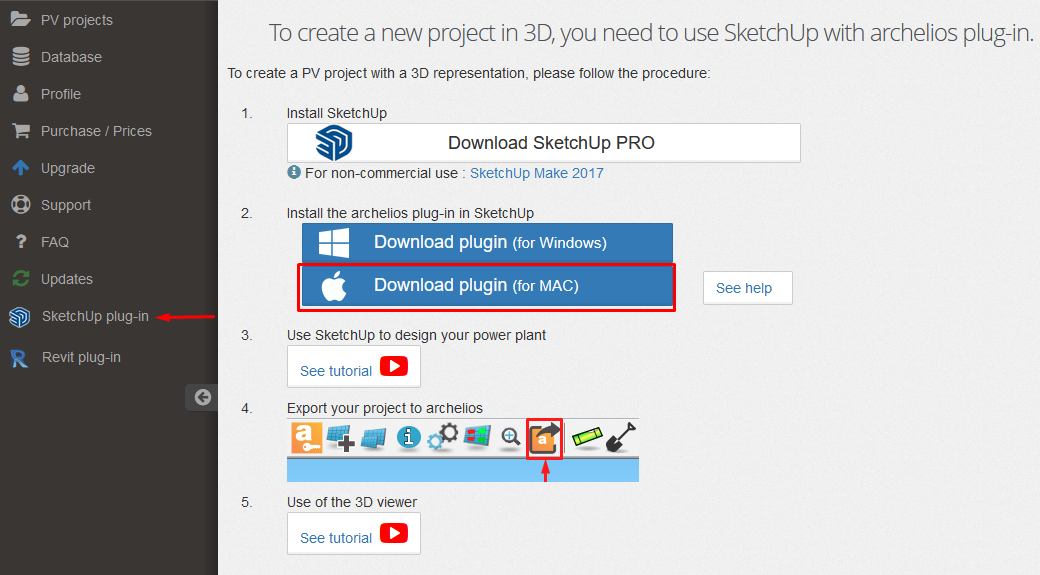
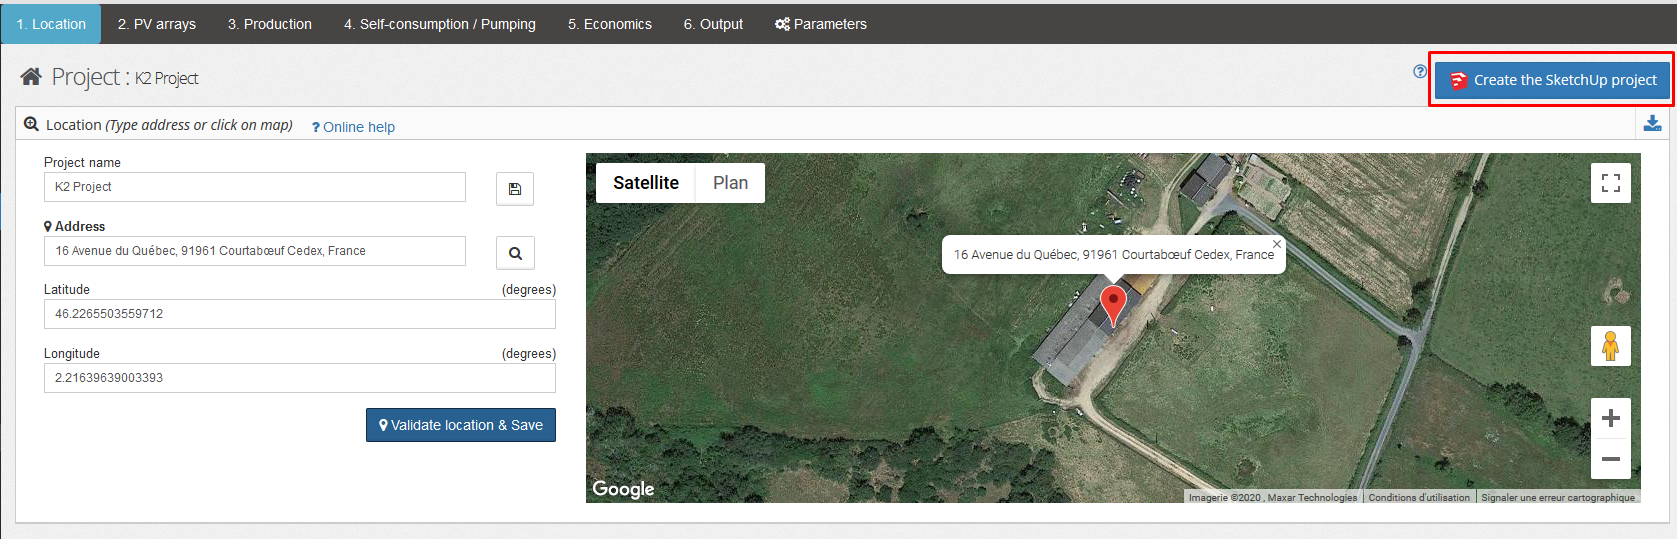
The creation of the Sketchup project from archelios Pro.
- Install the plug-in
- Open SketchUp and log in to the archelios PRO plug-in
-
Create the SketchUp 3D model
Database
How do I manage my database on archelios? manageDatabase
A specific page is available in the left menu to access the database management.
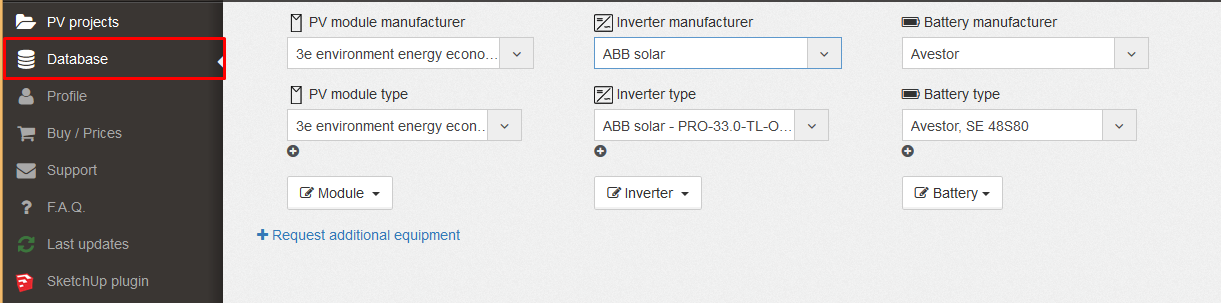
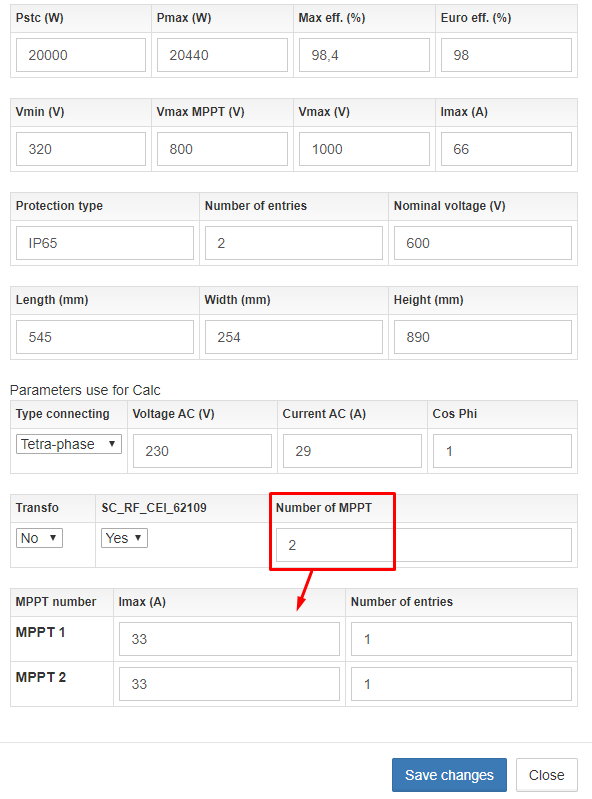
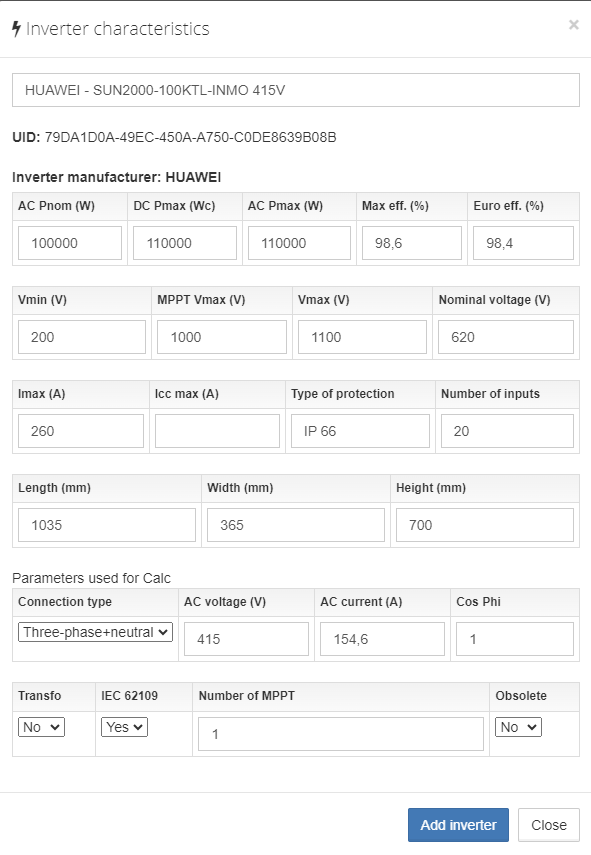
How do I edit the different MPPTs of an inverter? editMPPTInDatabase
You can add an inverter with multiple MPPTs or edit one.
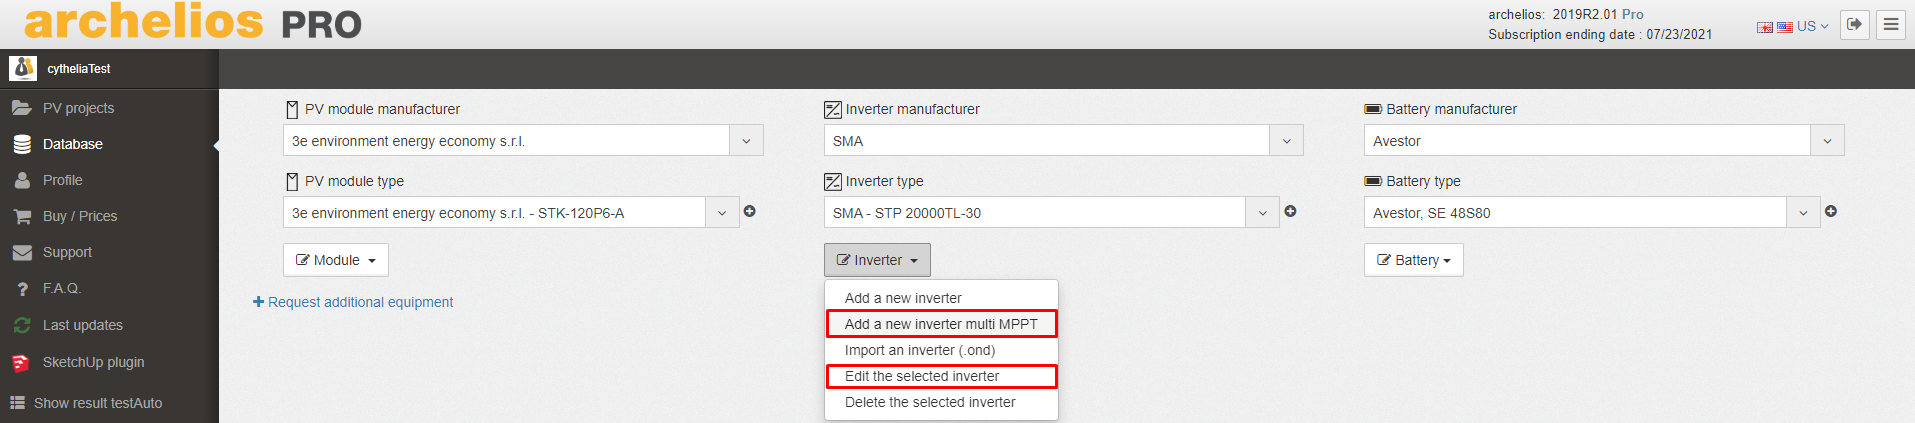
You can enter the number of MPPTs and specify the maximum current and number of inputs for each MPPT.
How can I place my modules from east to west (or other) in archelios PRO? eastWestIntegrated3D
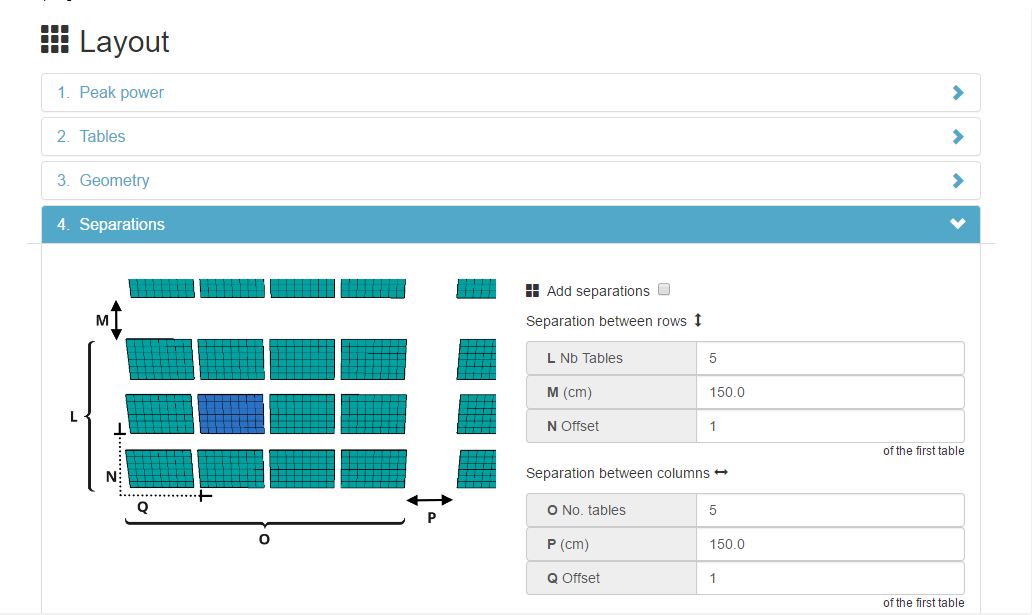
- The 'L' and 'O' parameters define the number of tables between each separation.
- The 'M' and 'P' parameters define the length of the separations.
-
The 'N' and 'C' parameters define the number in the grid of the first table (to be left at 1 by default)
Ex: If Q=1 and O=5 the first separation will be after 5 tables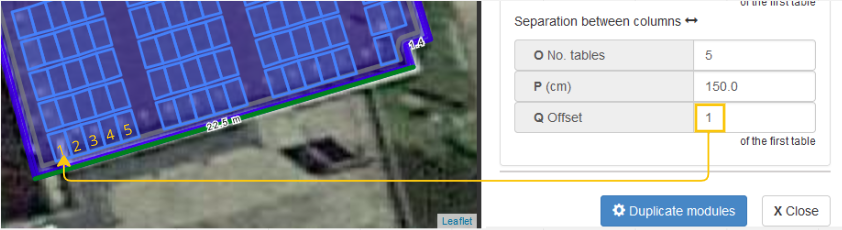 Ex: if Q=2 and O=5 the first separation will be after 4 tables and the following ones after 5 tables
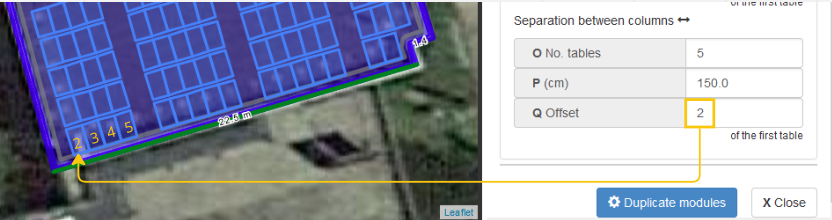
- On archelios PRO 3D: on the point at the bottom left of the roof.
- On SketchUp: on the first module placed before the duplication.
Module-inverter configurations
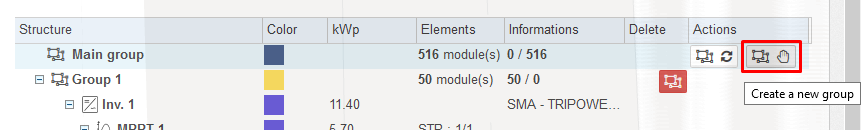
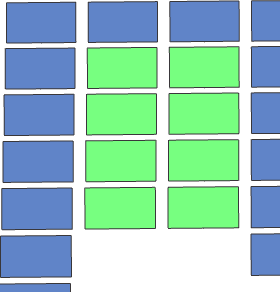
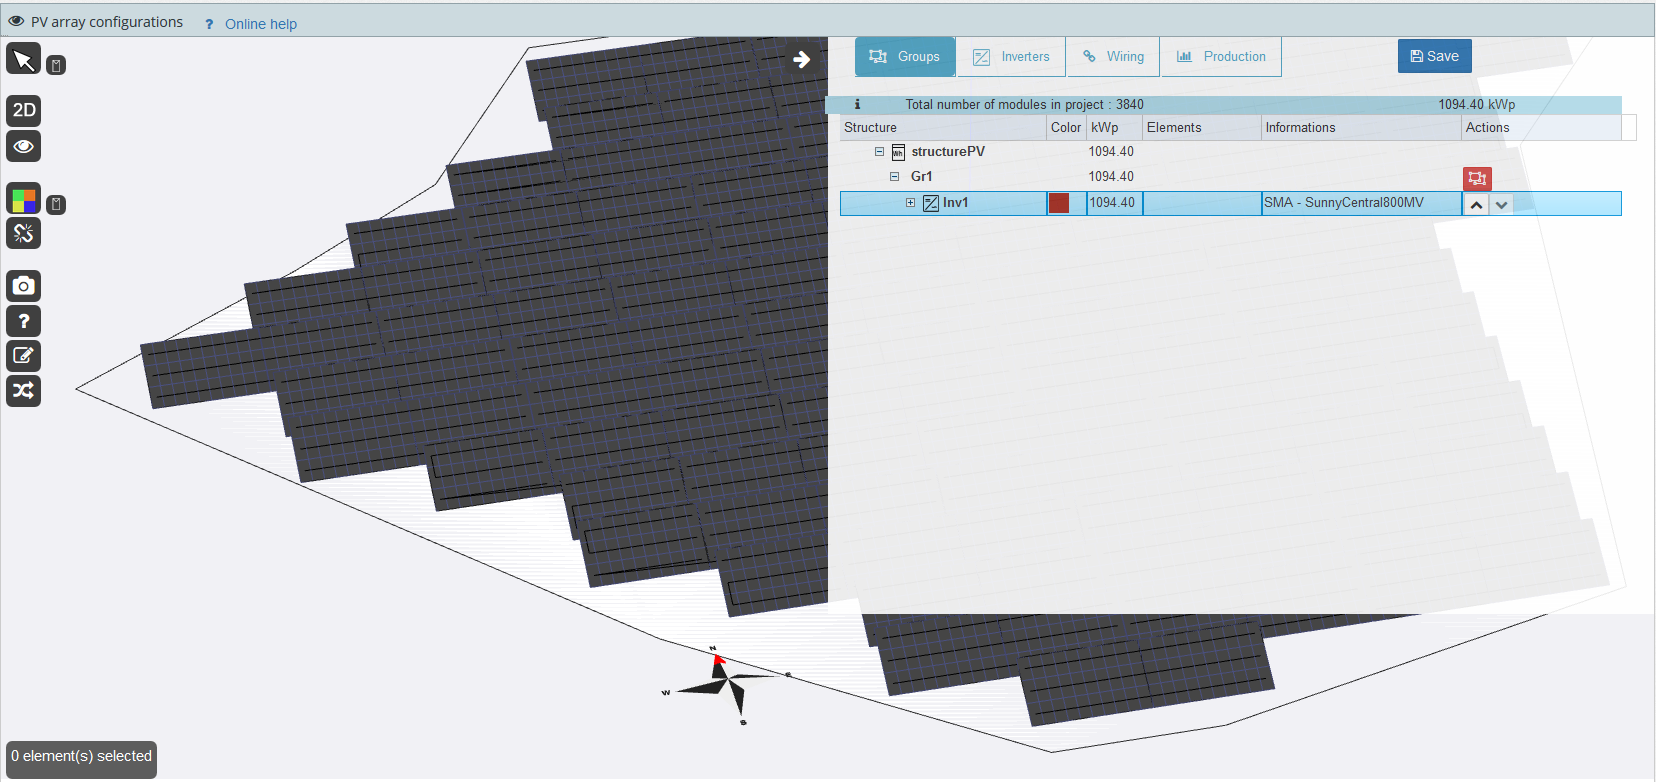
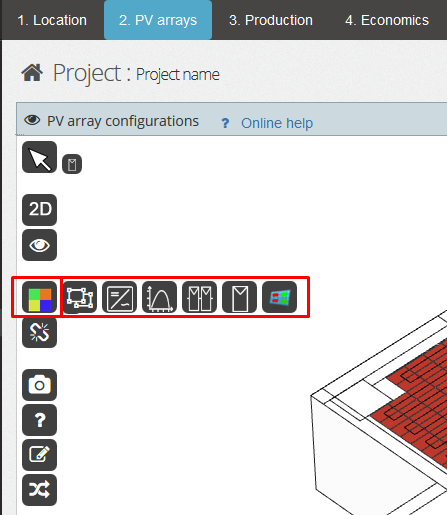
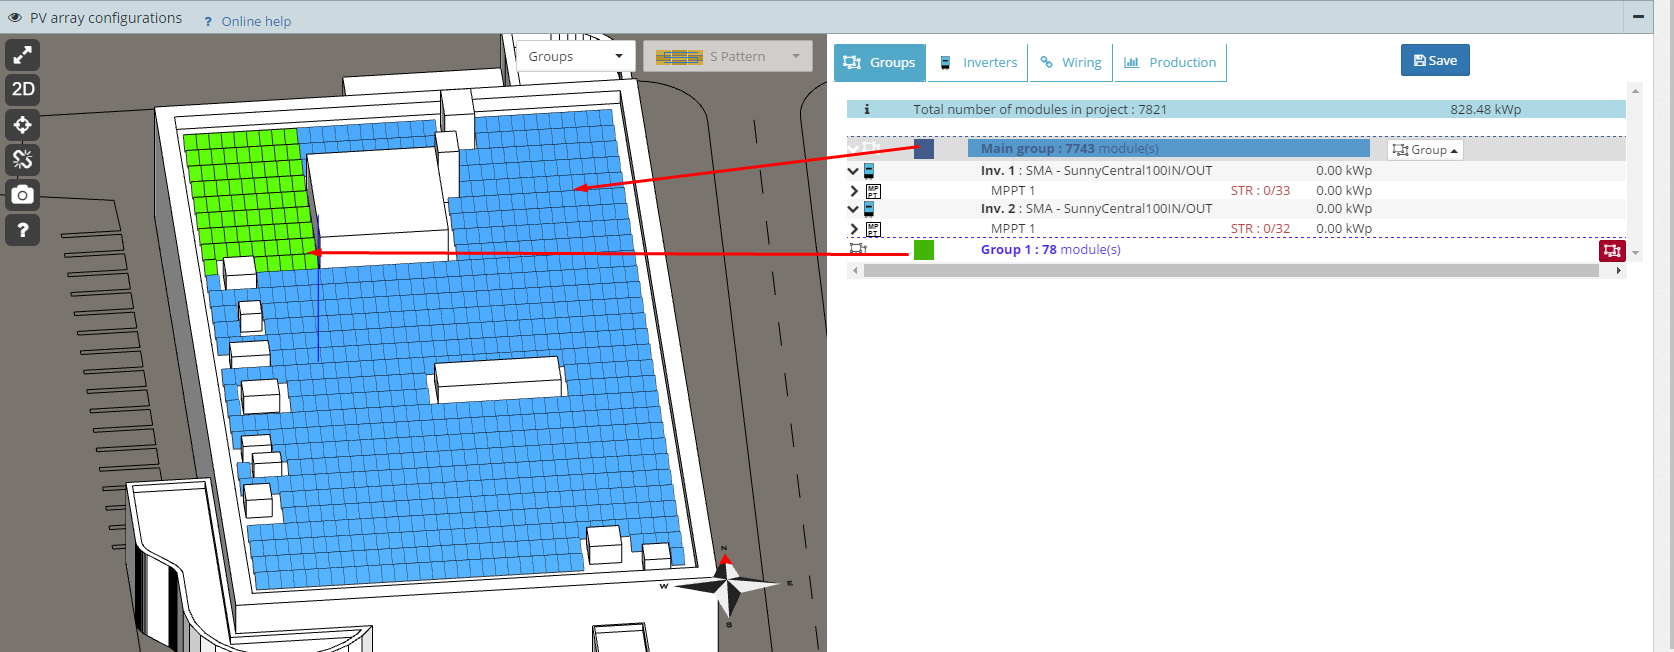
How do I create PV module groups? createPVModulesGroups
-
Click on the button to automatically create the groups. This button automatically generates groups according to the orientation and tilt values of the modules (there will only be one group if the modules have the same orientation and tilt)

-
You can also create your own groups manually
- Click on the button for manual group creation
- Select the required modules in a group with the selection box (cross-shaped cursor)
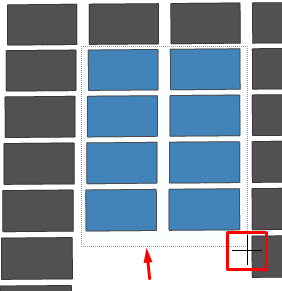
- Once the modules are selected, release the left mouse button and double click to validate the group
If you're not happy with the selection box, you can switch to 'line' mode. Proceed as follows:
- Do the step 1 again
- Press the 'F' key on the keyboard to switch modes
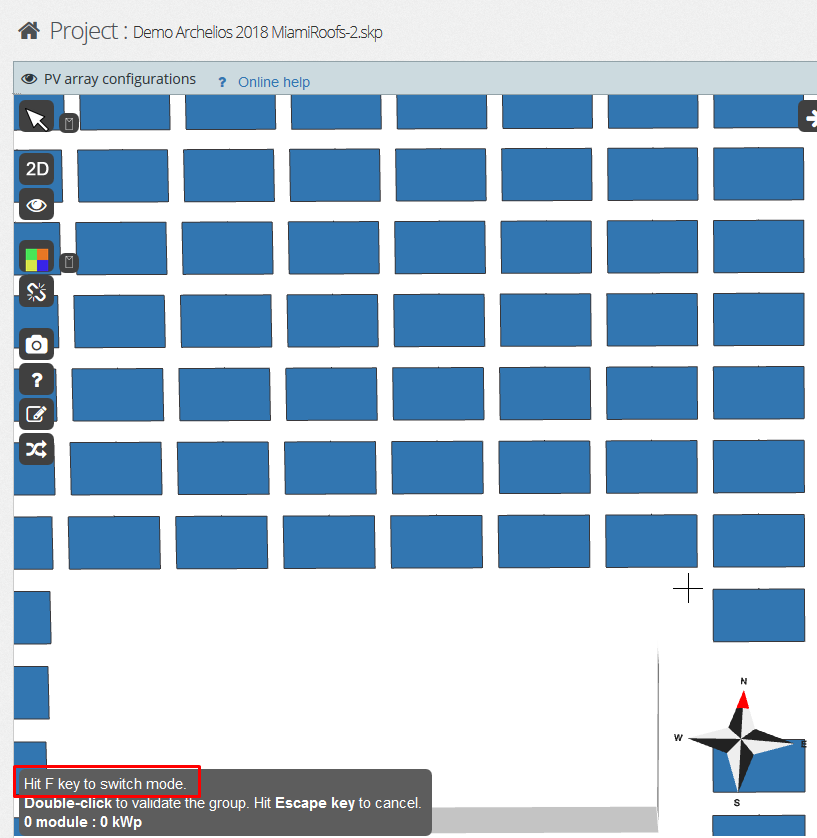
- Click on a first module
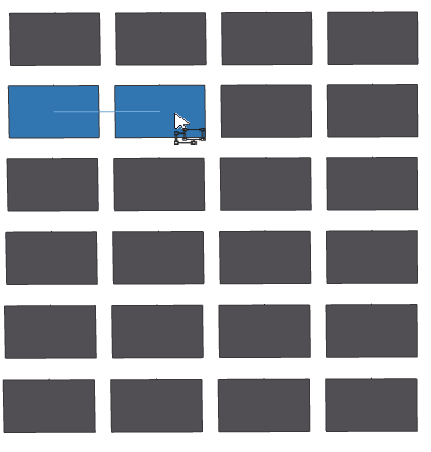
- Then click on another one to encompass all the modules
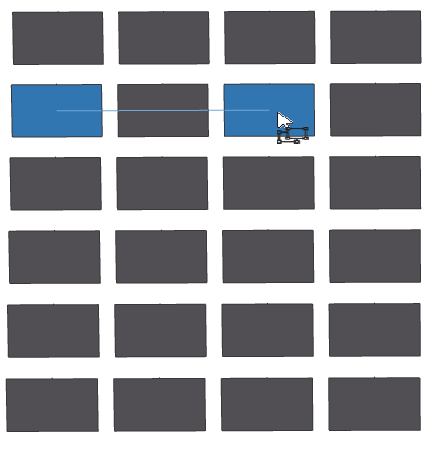
- That's 3 clicks here
-
Double click to validate the group
If you have separate modules that you want to put together in a group, you can use the 'manual' mode
- Do the step 1 again
- Then press the 'Ctrl' key on the keyboard and select all the modules you want
-
Double click to validate the group
- Click on the button for manual group creation
You can press the 'Esc' key to cancel the action.
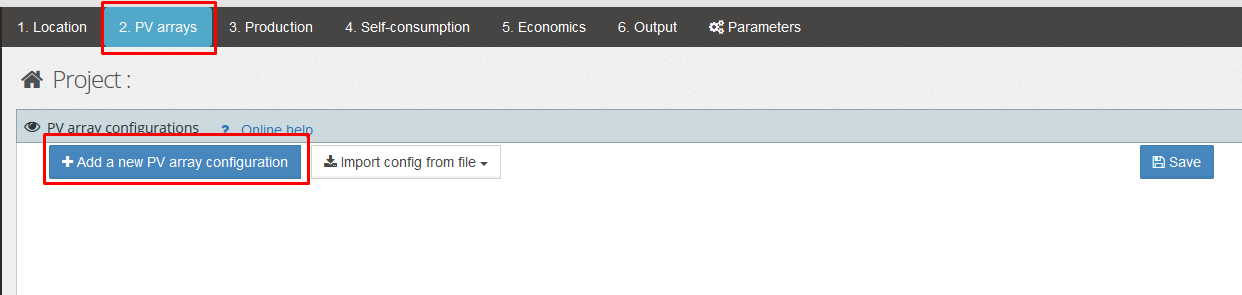
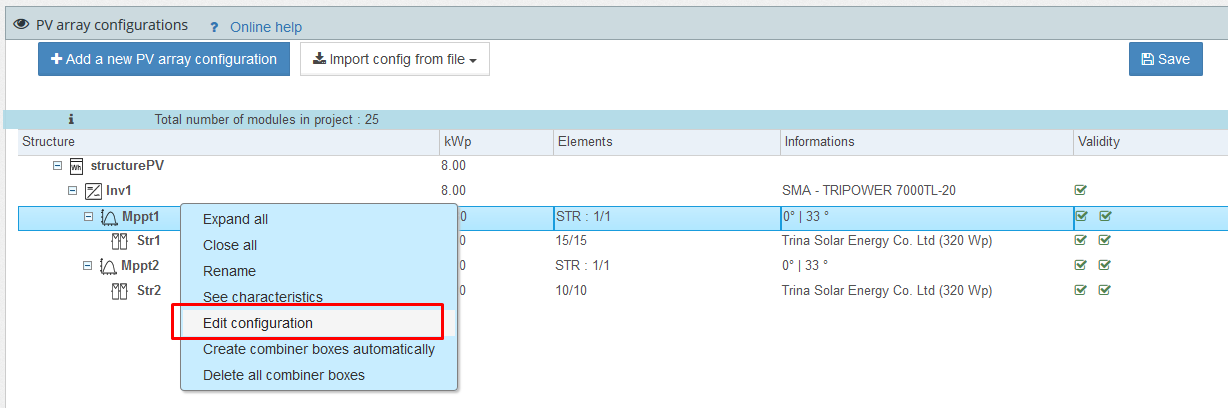
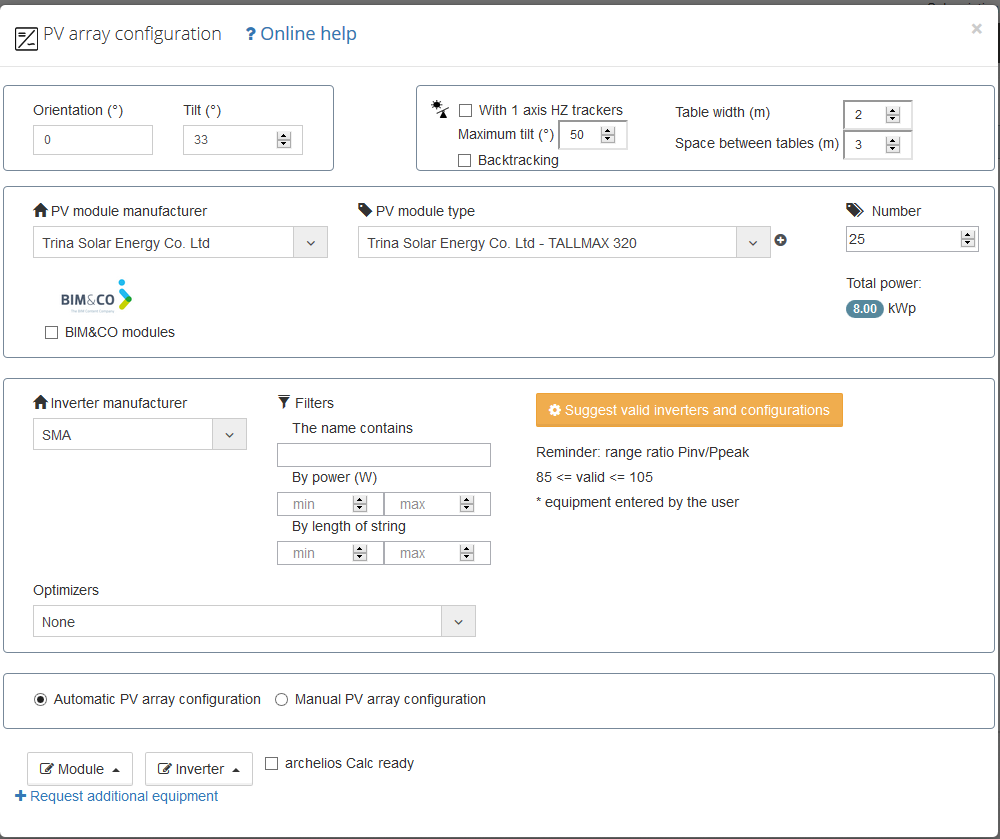
How can I add my PV configuration? addPVArray
If your project is not in 3D, click on 'Add a new configuration'.
If your project is in 3D, click on the 'Inverters' tab and then the 'Inverter' button for each existing group. 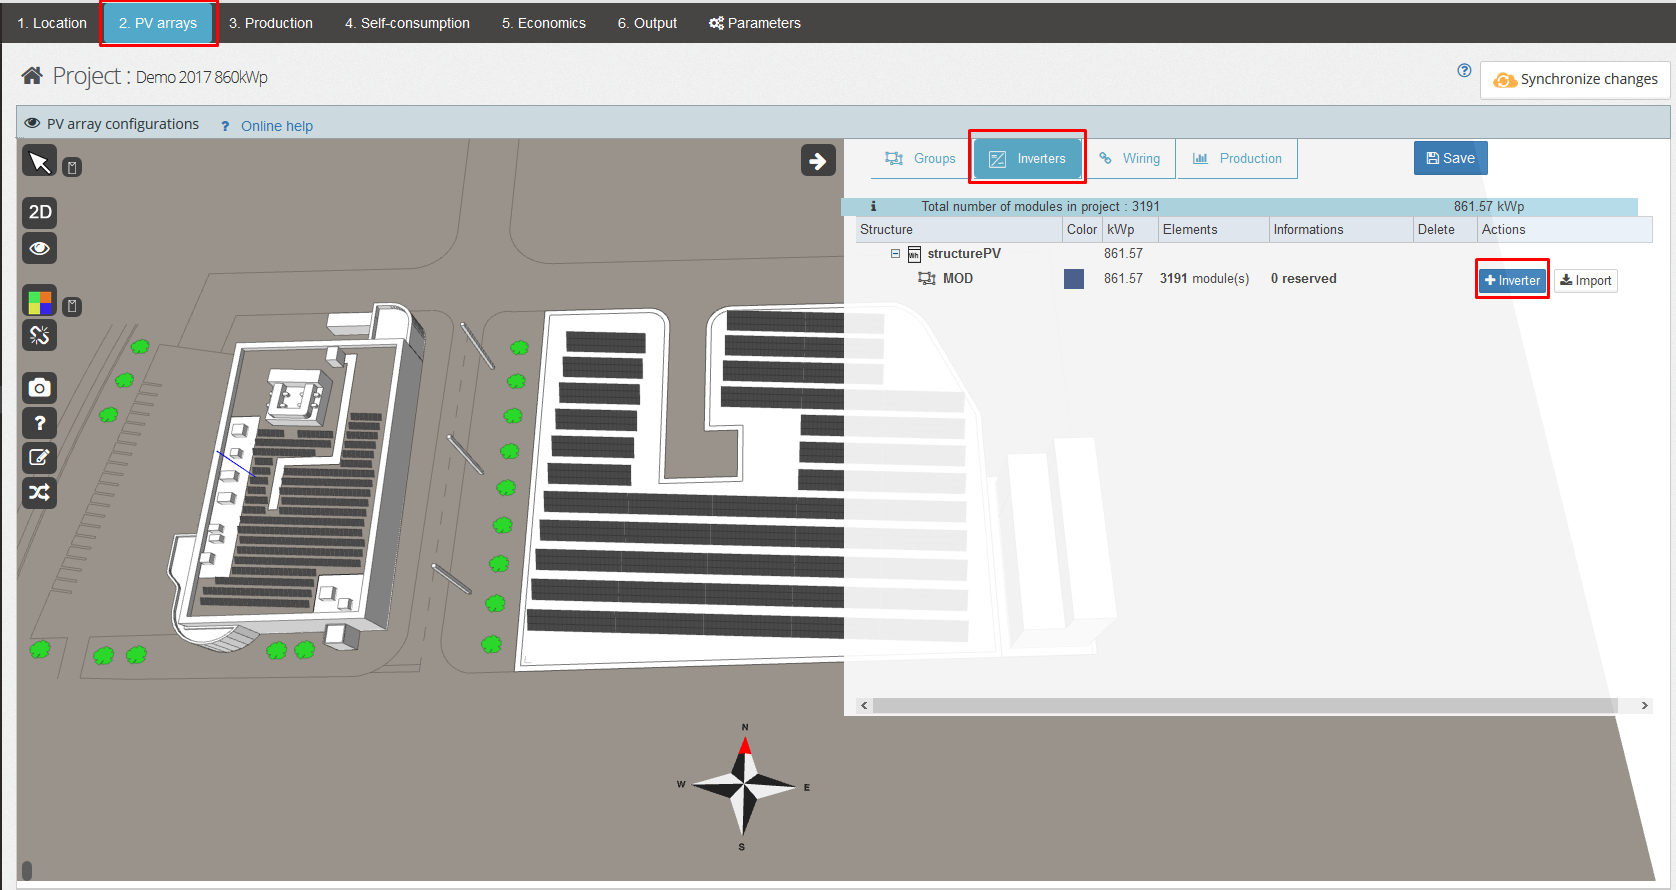
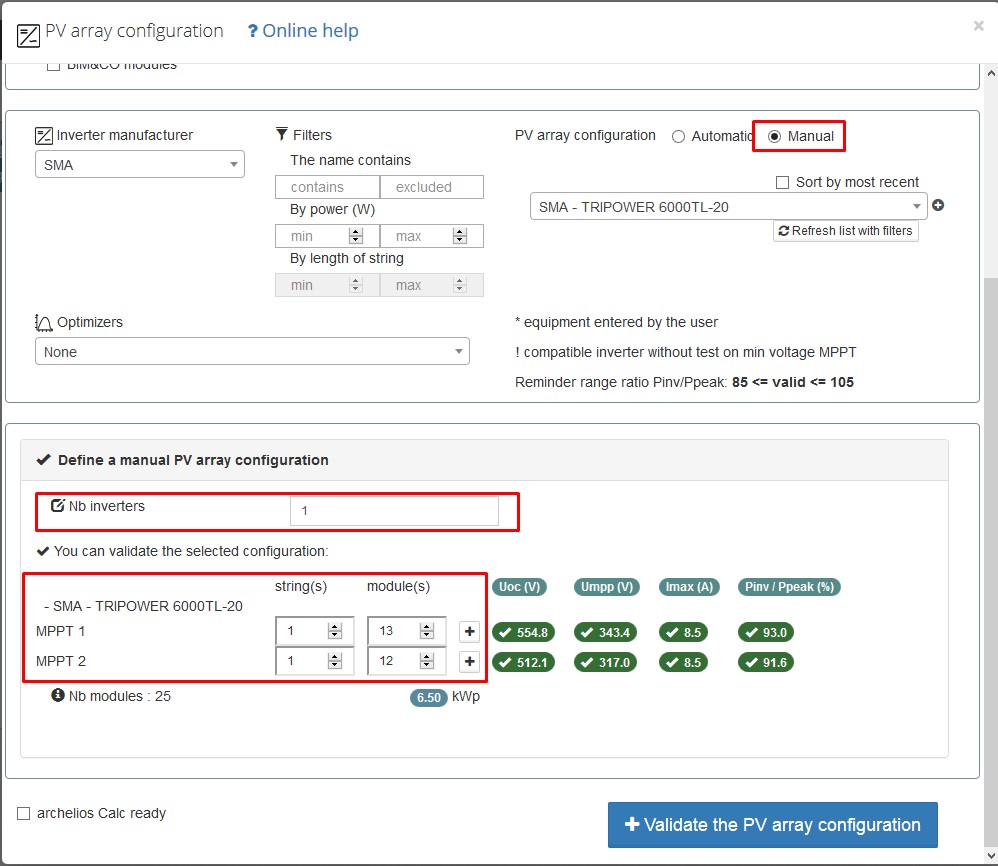
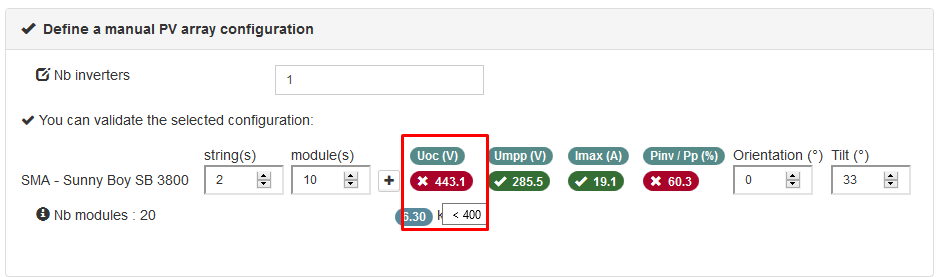
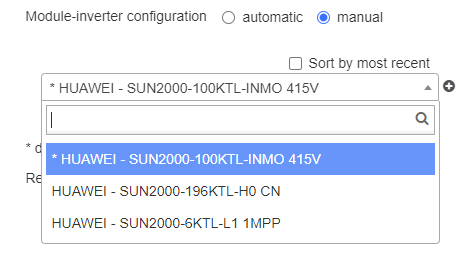
My module-inverter configuration isn't available in archelios. Can I enter my own configuration? manualConfiguration
Click on 'Manual configuration' and choose your inverter and string distribution.
VmpModule = Vmp * (1 + voltage temperature coefficient * (max temperature – 25))
The maximum temperature is defined in the general simulation parameters (last tab)

archelios takes into account the MPP range since this range guarantees the best possible performance for the inverter.
VcoModule = Vco * (1 + voltage temperature coefficient * (min temperature – 25))
VcoString = VcoModule * number of modules in series
The minimum temperature is defined in the general simulation parameters (last tab)
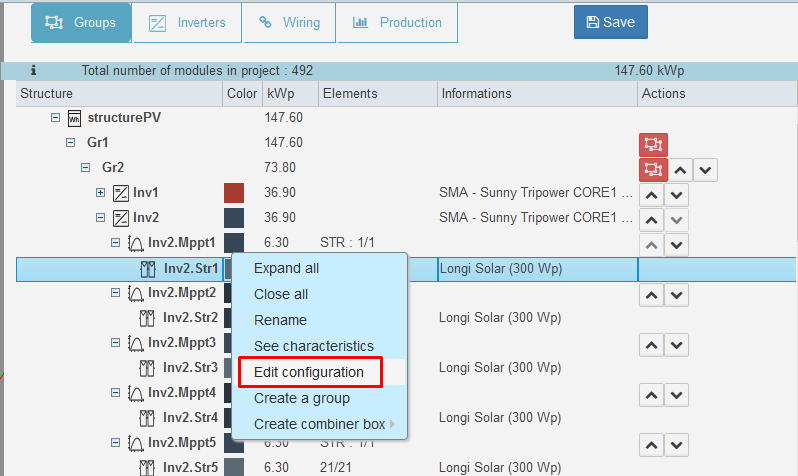
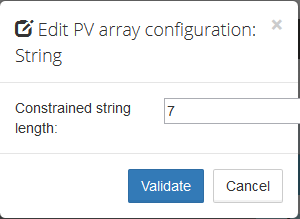
How can I change the number of modules in a string? changeNumberModulesInString
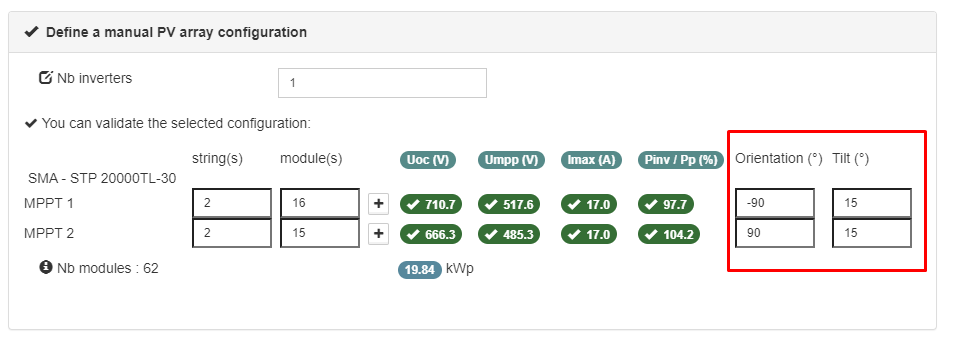
If I don't use SketchUp, how can I have two different orientations on the same inverter? twoOrientationsWithout3D
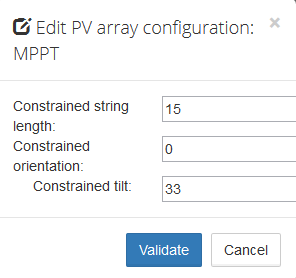
You can also enter directly the different orientation or tilt values for each MPPT with the manual configuration.
How can I see the module or inverter characteristics? seeCharacteristics
Before choosing your hardware, you can see its characteristics by clicking on the '+' button in 'Add a new configuration'. 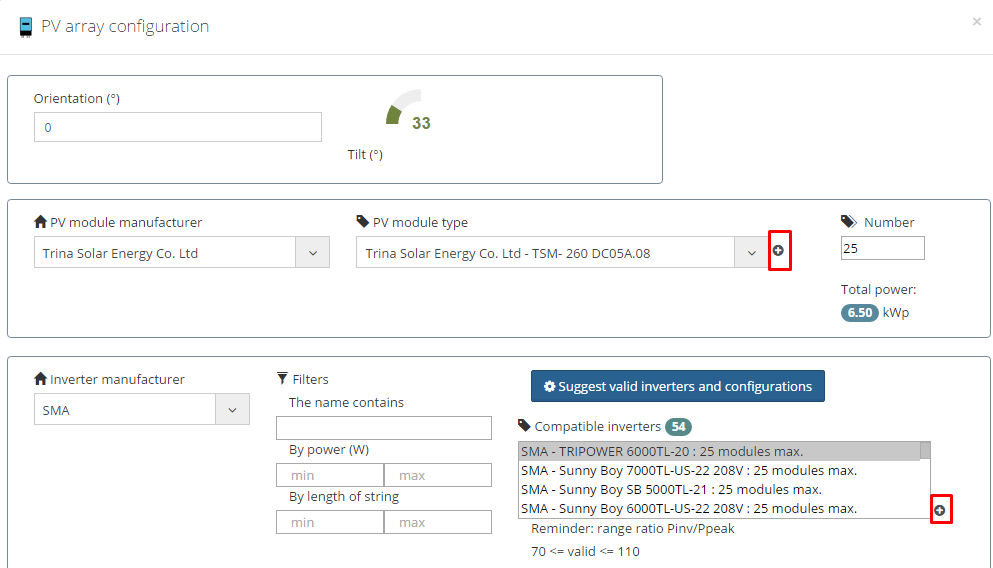
If you have already chosen your equipment, you can see the module or inverter characteristics by right-clicking on the corresponding line in blue. 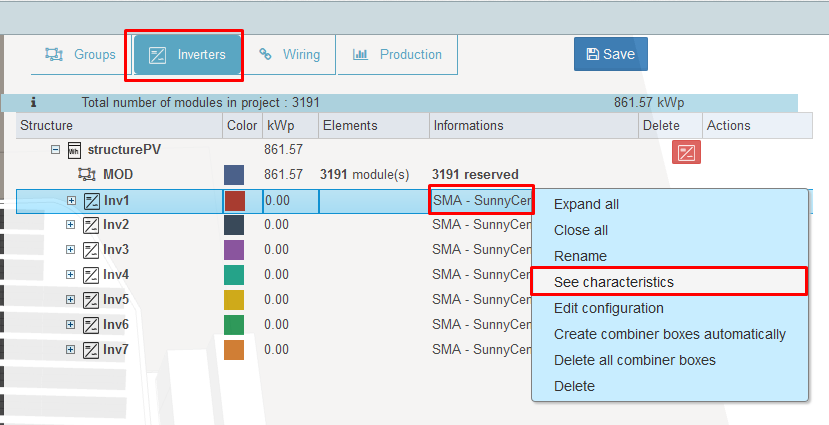
We regularly update our database, so you can send us the data sheet and we will notify you as soon as your equipment is listed in our database. You can also fill in the form in archelios by clicking on the following link: : Request to add equipment
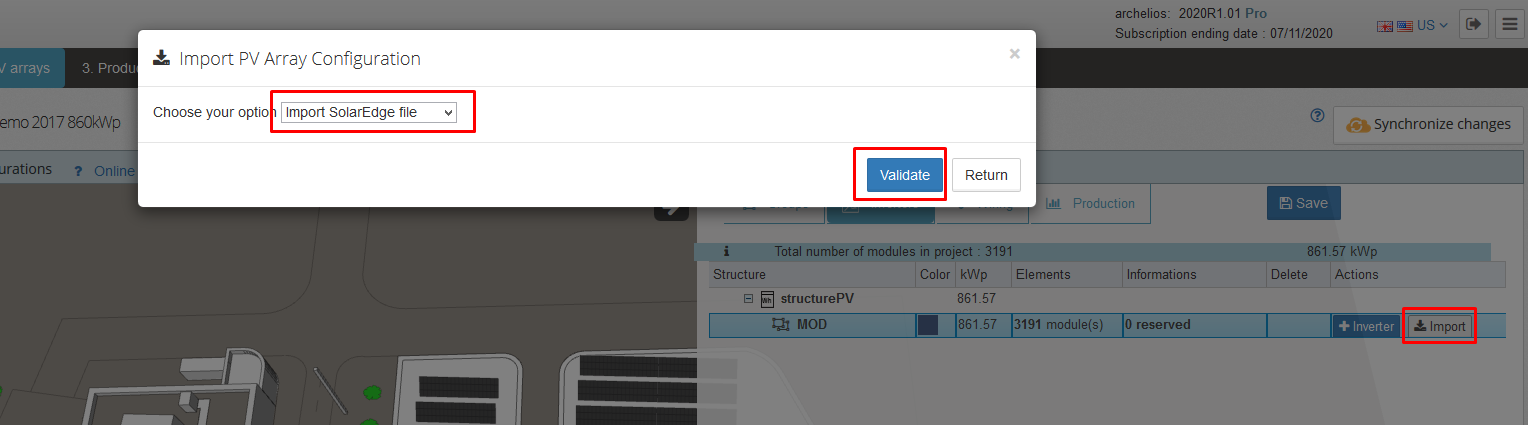
How do I import a Solar Edge file with optimisers? importSolarEdgeFile
In the 'Inverters' tab, click on the 'Inverter' button and choose 'Import Solar Edge file'
The view with optimisers is slightly different as the string number is displayed on the right 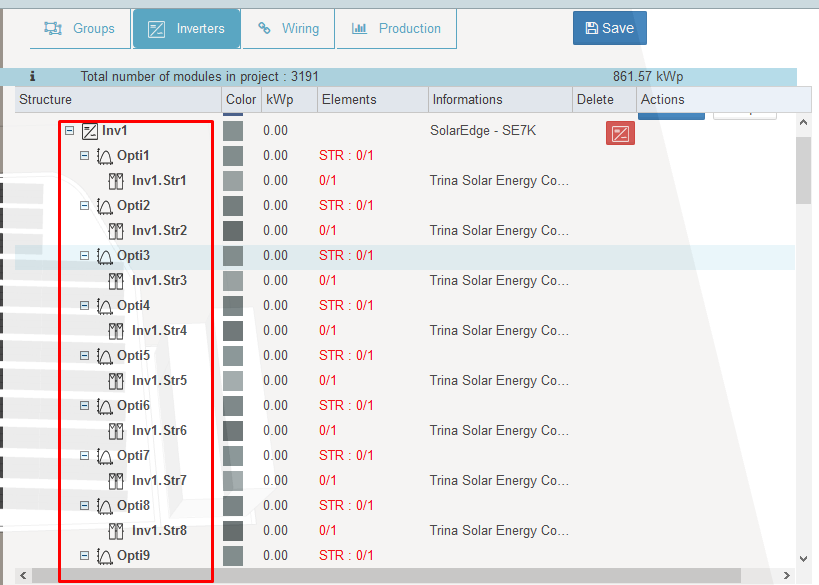
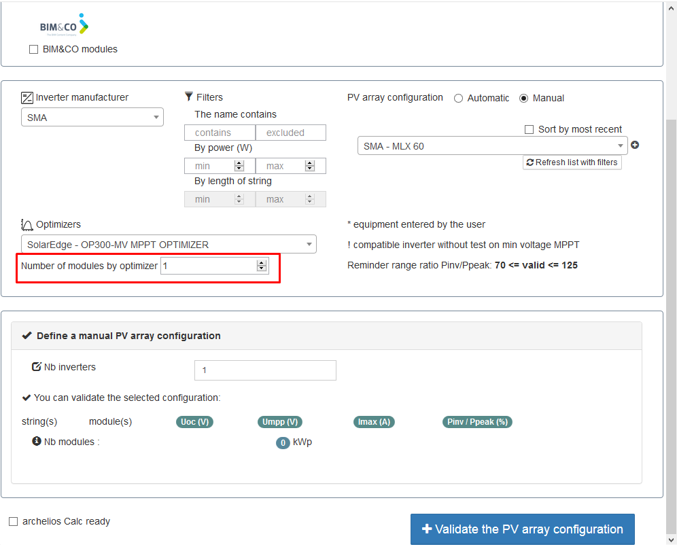
How do I create a configuration with optimisers? optimizersConfig
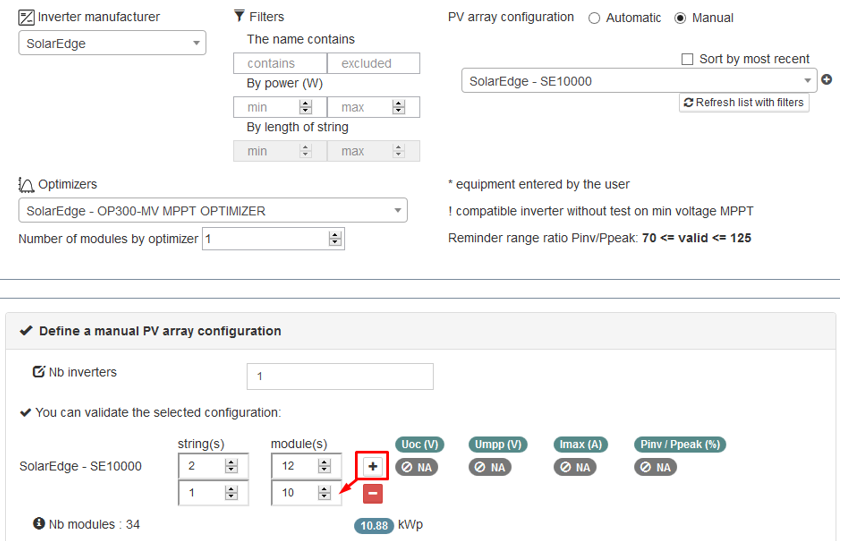
You can specify the number of modules per optimiser
You can also define different string lengths at once (click on the '+' button)
The optimiser strings are saved in the structure and displayed in the configuration tree.
In our example, we have 3 optimiser strings named 'StrOpti':
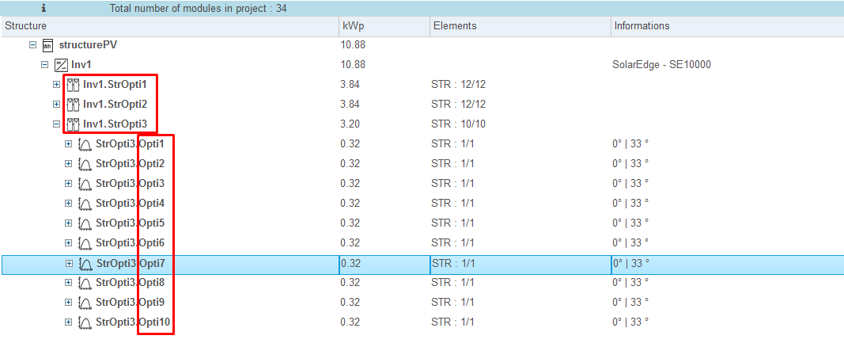
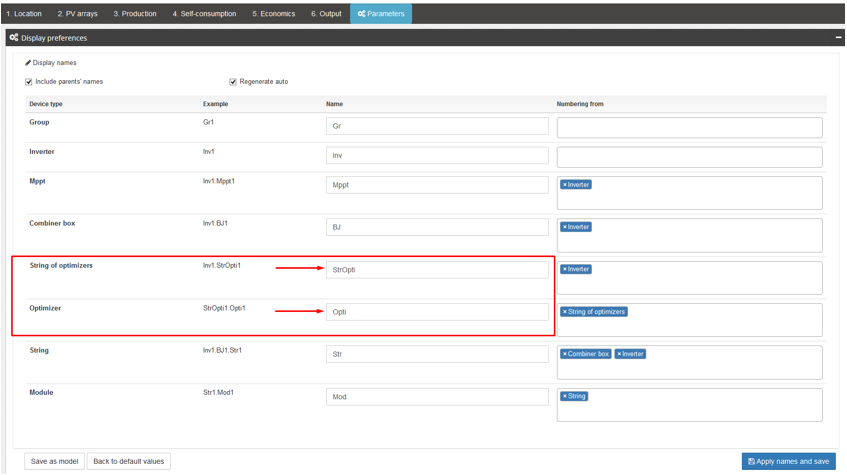
The display names of the optimisers and optimiser strings can be changed in the 'Display preferences' panel of the 'Parameters' tab.
How to use an inverter with several multiple optimizers ? optimizersConfigWithMultiMPPT
Find the reference in the database
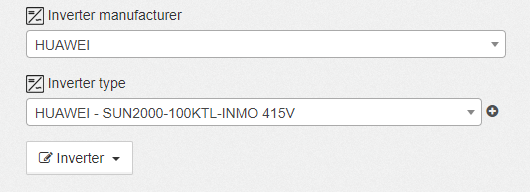
Duplicate the reference in the database (Add a new inverter = from the selected reference)
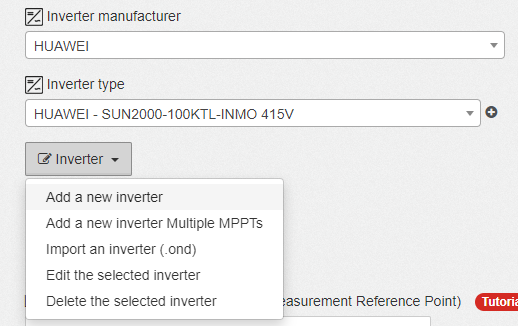
Remove the other MPPTs / check the presence of a single MPPT
The reference is now available in the list
Inverter video link with multiple MPPT : Click here
Once my project is exported from SketchUp to archelios, can I change the module reference without redesigning my project? changeReferenceModule
- In the 3D view, select the module group
- Click on the 'Change module reference' button (at the bottom left)
- The proposed modules are only those modules with the same dimensions as the module to be replaced
How can I limit the power of my photovoltaic installation ? staticBridging
The restriction has no impact on the quantity of energy produced.The aim of this manipulation is only to limit the electrical power output from the photovoltaic inverter.


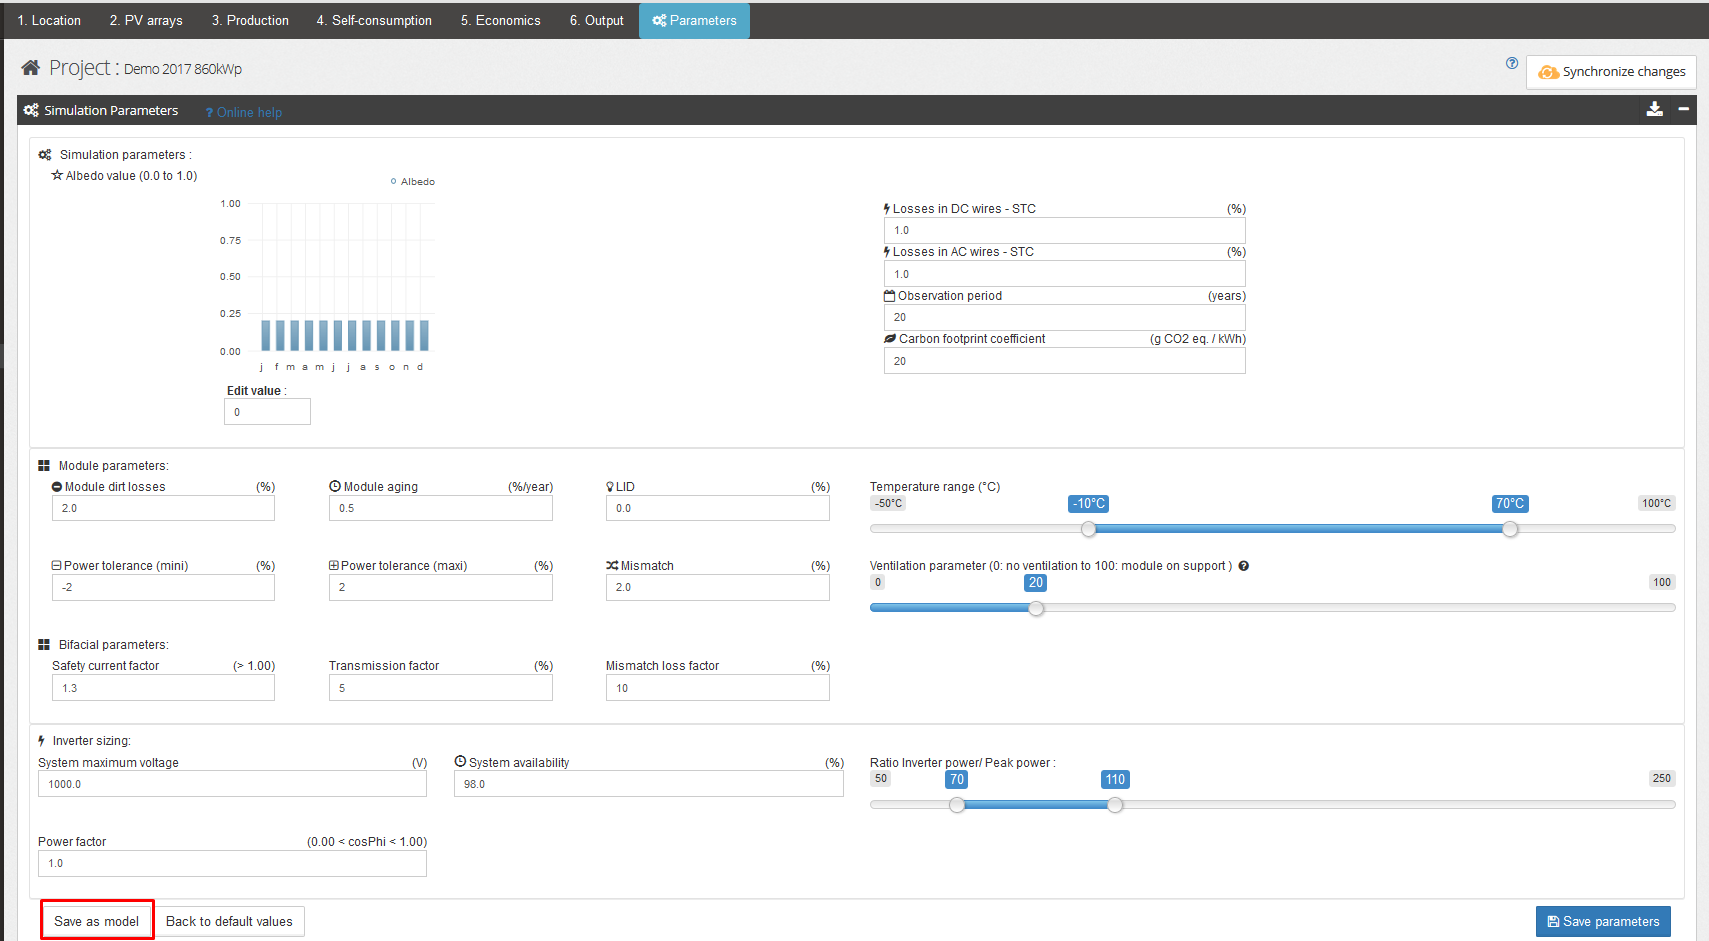
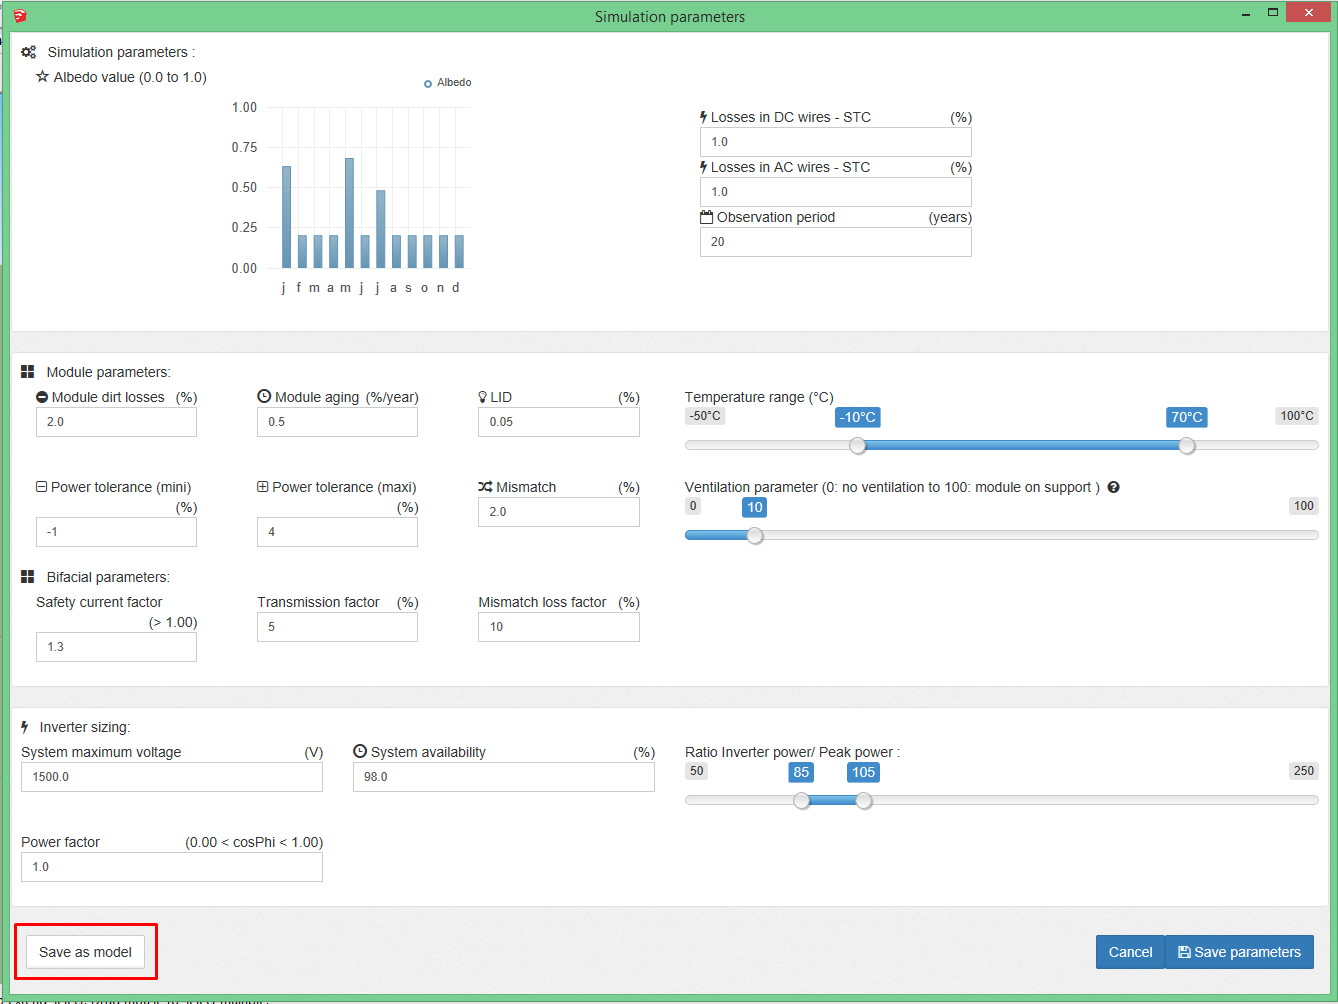
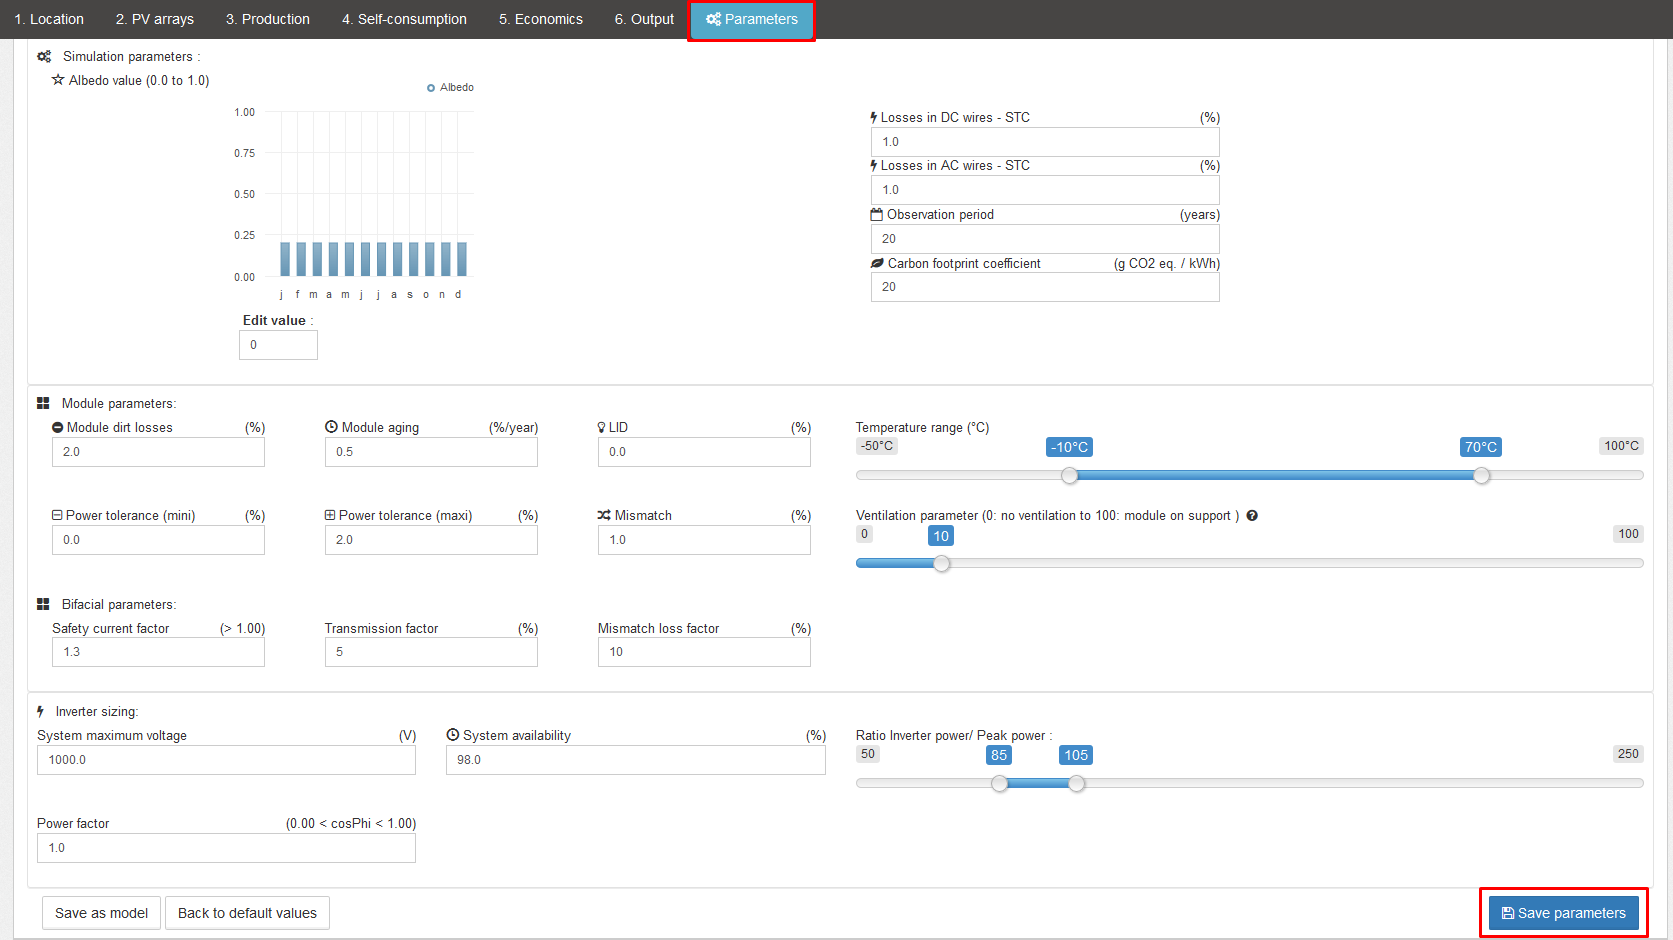
Limiting by the power factor makes it possible to limit the power of the inverter by adjusting the power factor of the installation. To do this, simply modify the cos Phi in the project simulation parameters. (See illustrations below)


Limiting by power of the inverter allows you to reduce the power of the inverter directly from the technical sheet. To do this, simply enter the inverter reference from the database and limit the inverter powers. (See illustrations below)


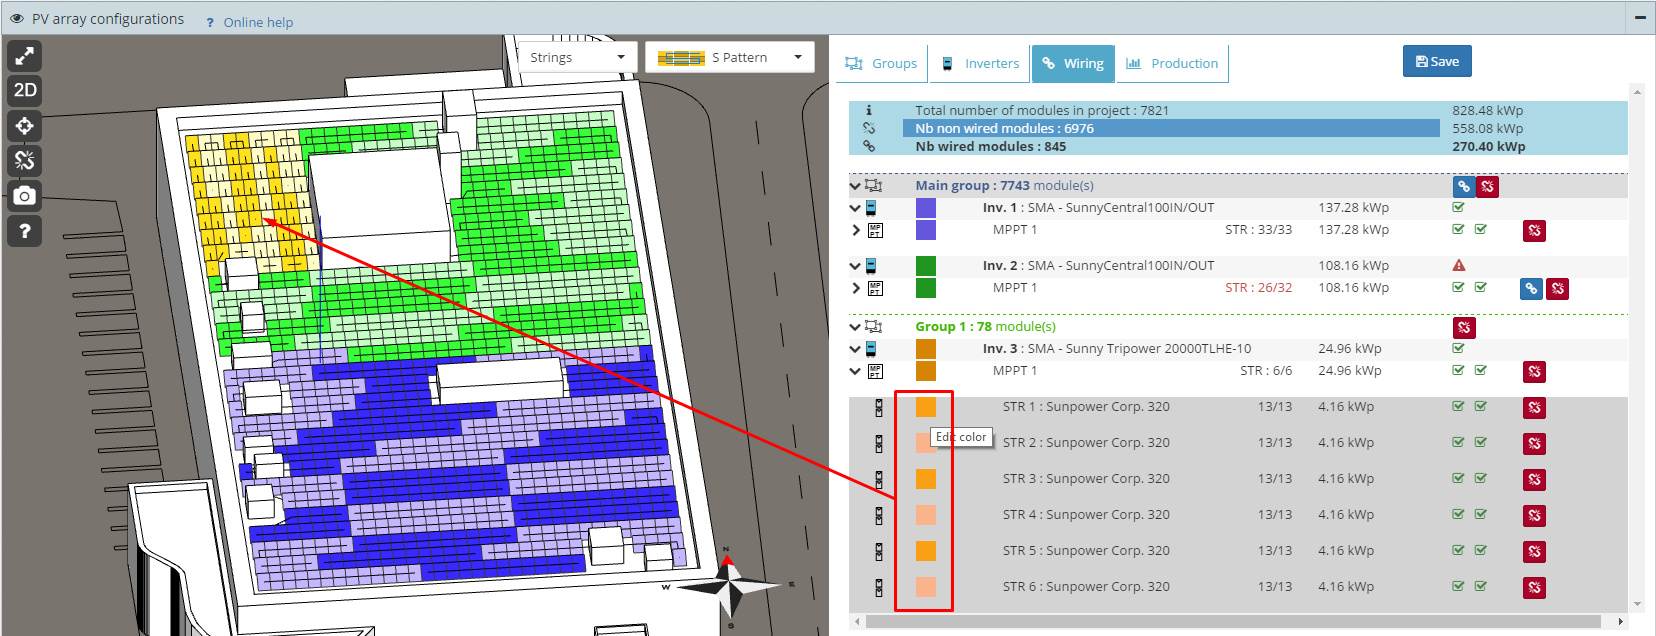
Wiring
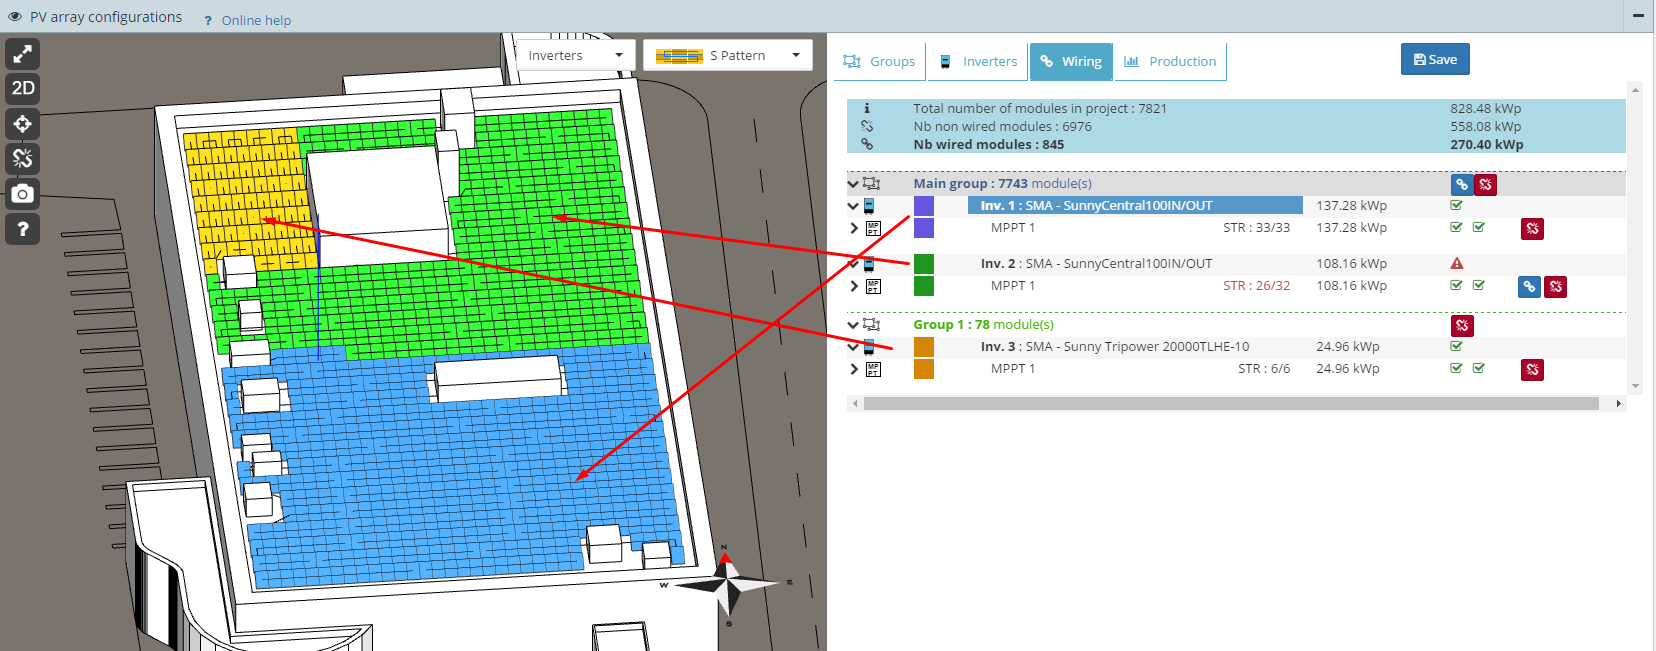
How do I wire my PV array? wirePVArray
Click on the wiring icon for the group (or MPPT or even the string if you want to wire them separately) and follow the instructions in the bottom-left corner of the 3D view
What is the difference between the wiring modes? wiringModes
I'm not happy with the results of the automatic wiring feature. How do I create my own wiring? wireManuallyPVArray
You can wire using the 'Manual wiring' button, which can be found in the strings
Click on the icon to the left of MPPT to expand the strings.
Manual wiring works in the same way as automatic wiring, but with a few differences (no wiring restrictions):
- Click on the first module
- Using your mouse, click on the modules that you want to add to the string (if you click on a module that is already in the string, it will be removed)
- Double click (or click on the last module) of the string to validate.
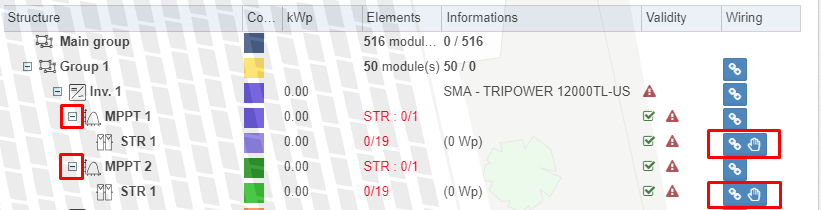
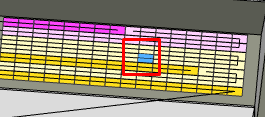
How can I find which inverter a string belongs to? stringBelongToInverter
Select a module in the string (it turns blue).
Then right-click on the module and choose 'Select' and 'Inverter'.
The inverter line turns blue in the table. 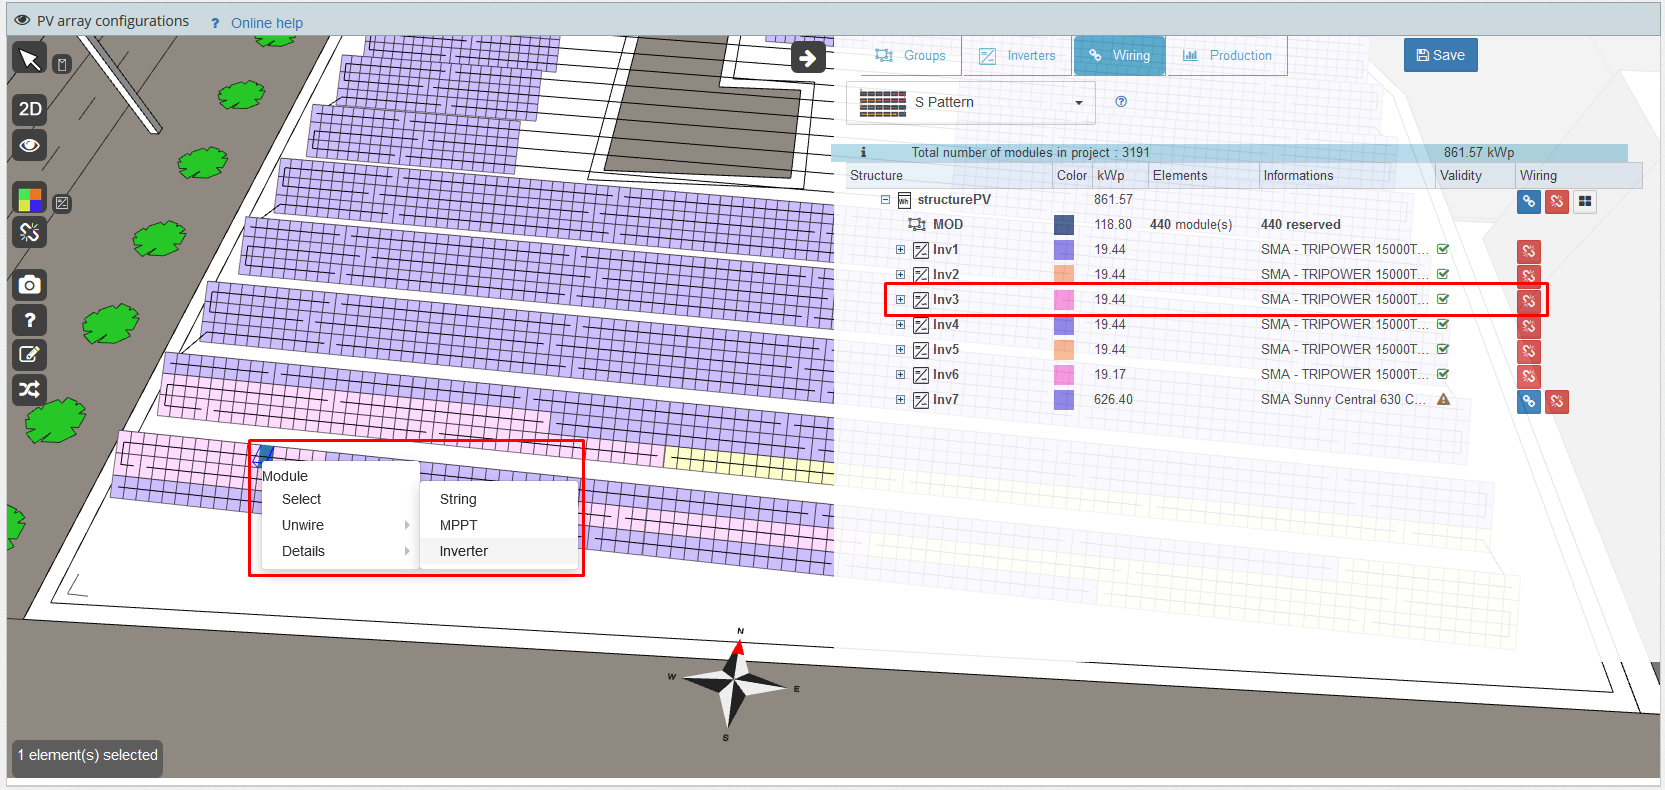
Production simulation
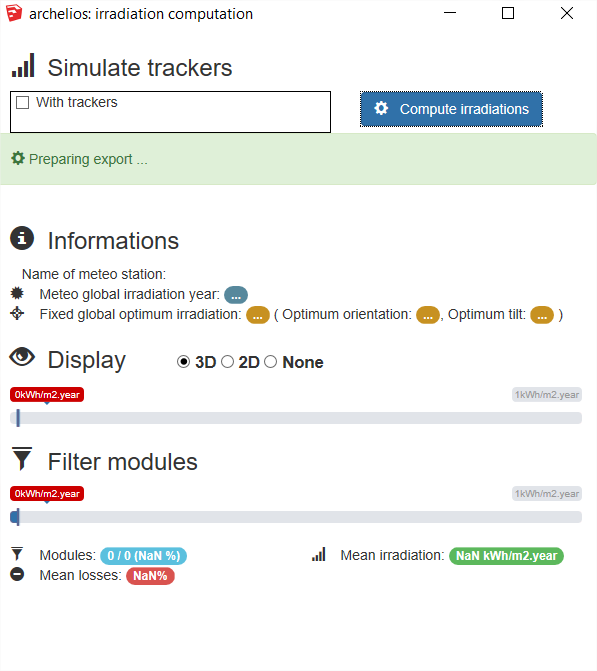
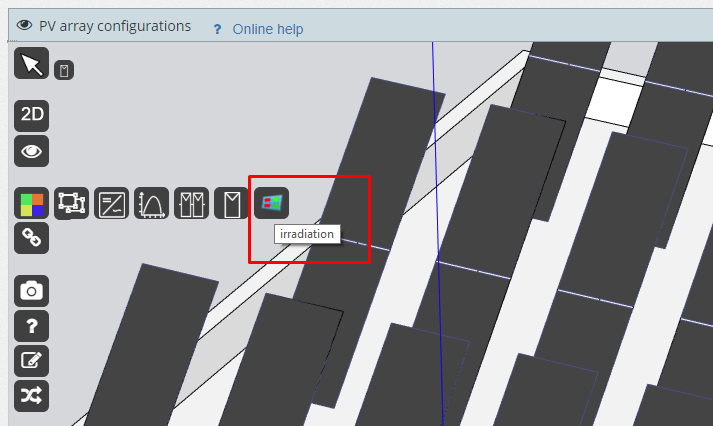
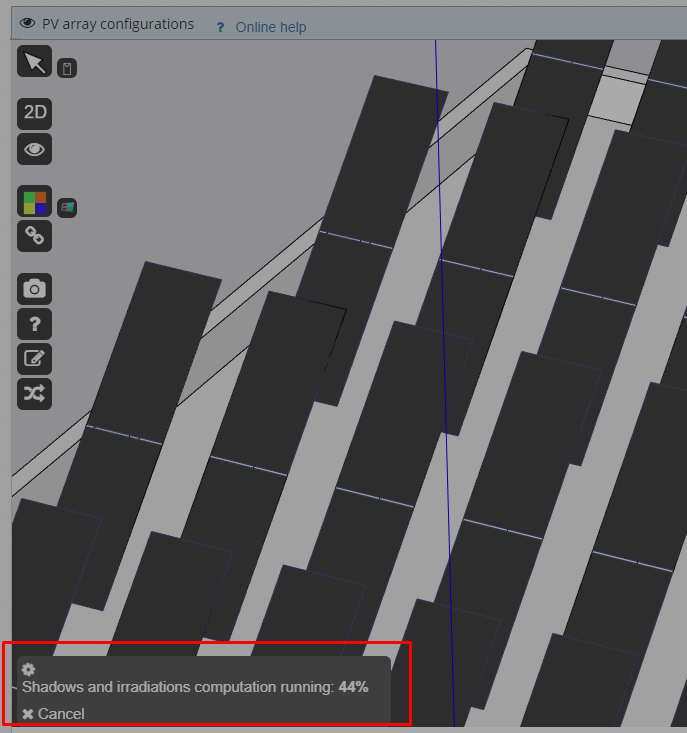
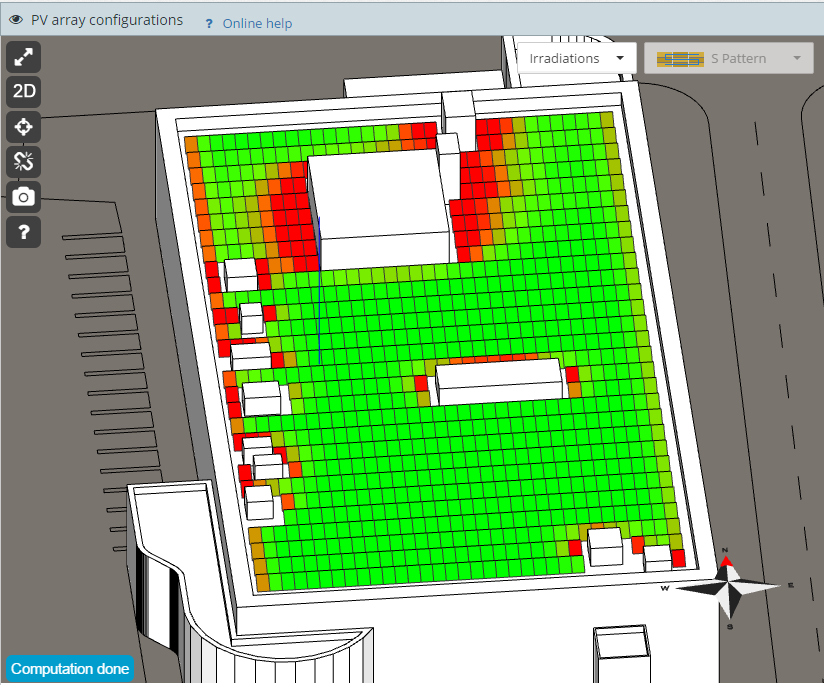
In the SketchUp plug-in, the calculating irradiation feature is still blocked. What can I do? irradiationsComputationLargePlants
In case of a large solar power plant, we would advise you to use the online irradiance calculation tool (and not directly from SketchUp).
After exporting, you can calculate the irradiation for the modules
You can track the progress
Once the calculation is complete, you can display the values by right-clicking on the selected module
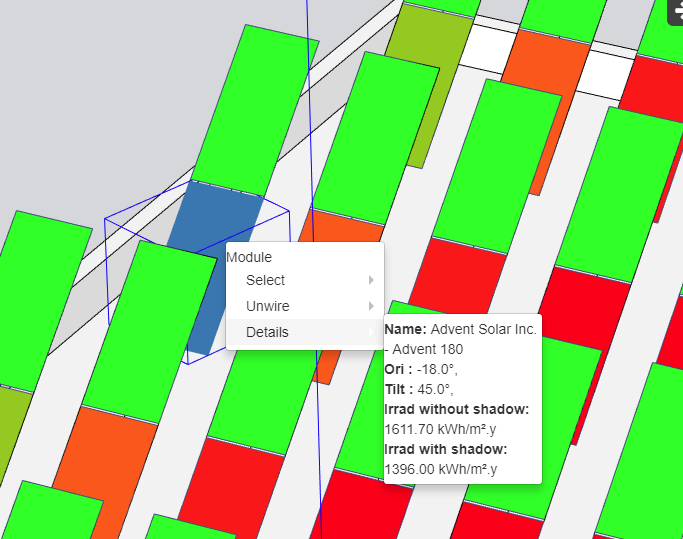
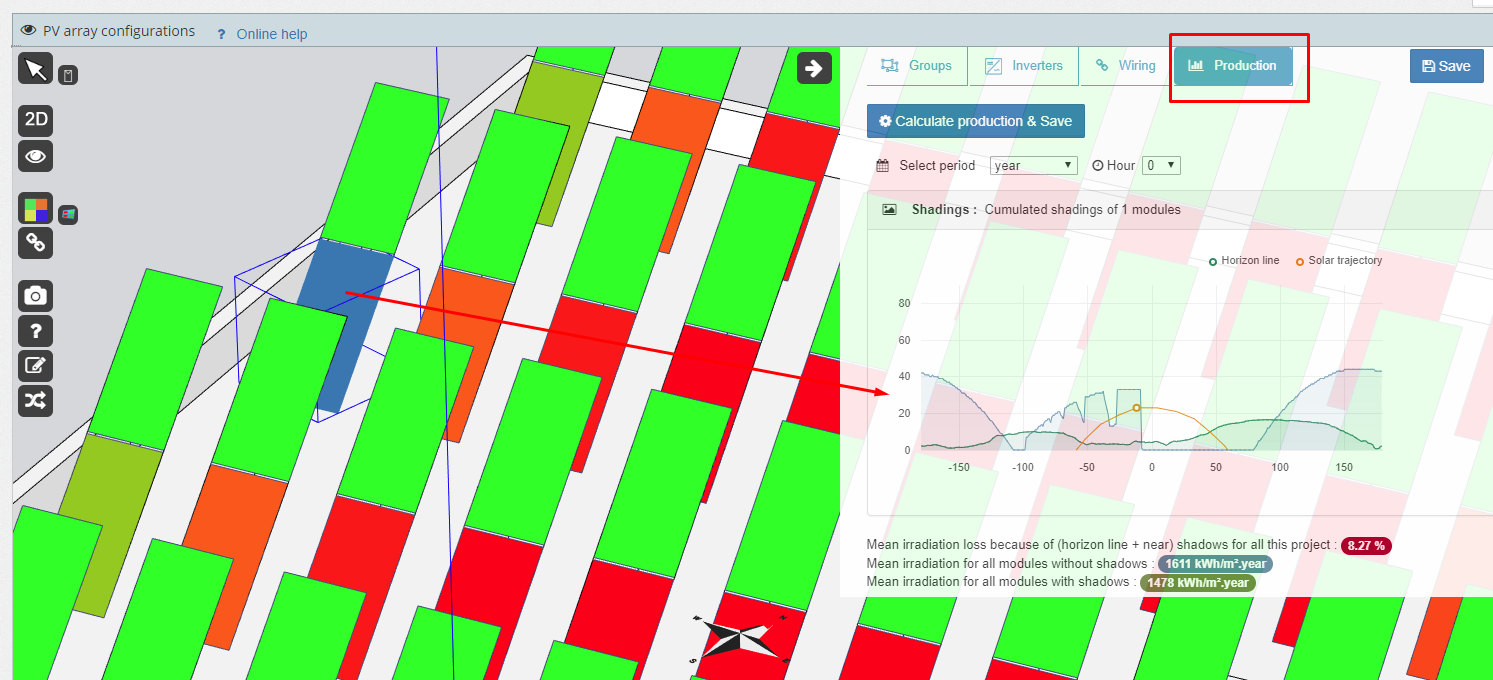
You can also access the shading for each module
How do I simulate my project with bifacial modules? bifacialModules
First, select a type of bifacial module from our archelios plugin on SketchUp 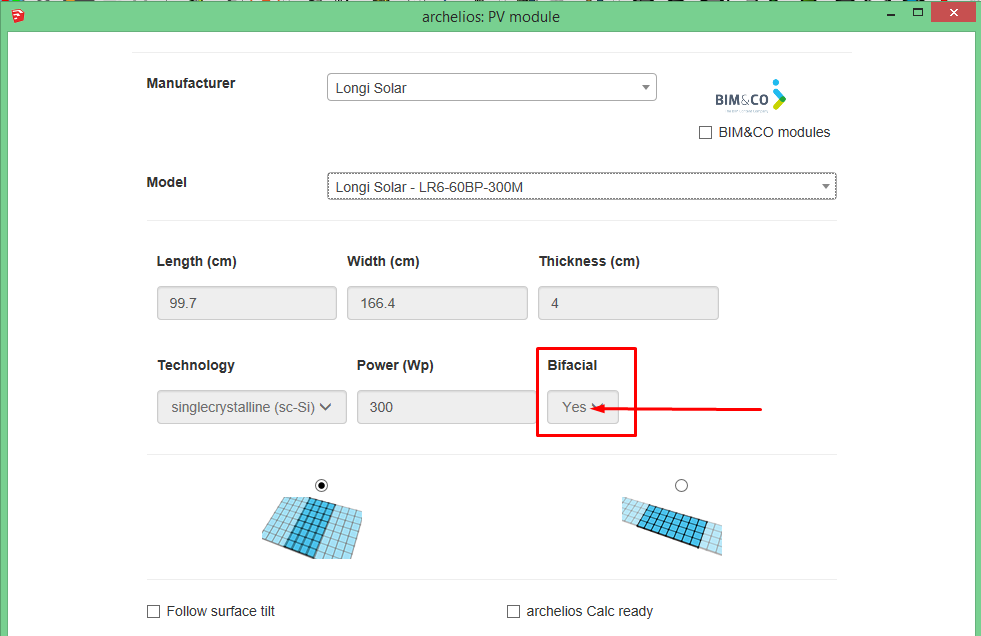
The gains with bifacial modules can only be calculated with a 3D project.
Note that the model for calculating the bifacial gain does not take account of the duplicated tilted surfaces (tilt over 5°). Feature under development.
Special case of solar canopies:
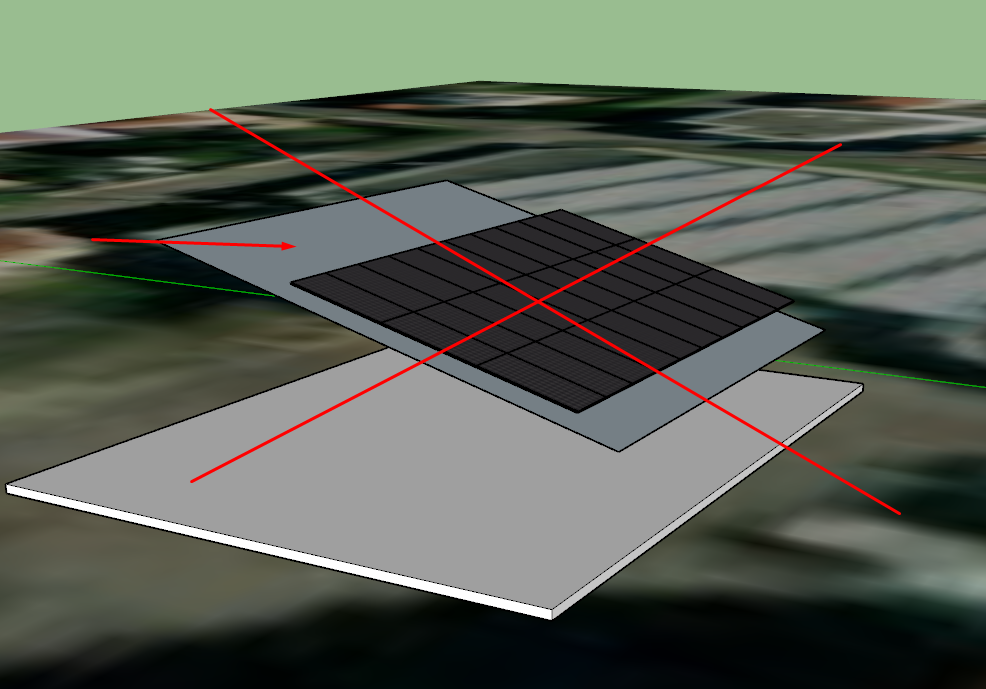
- Create the duplication surface on the ground
- Duplicate with the correct height parameter (this is the parameter that will be taken into account for the height of the modules)
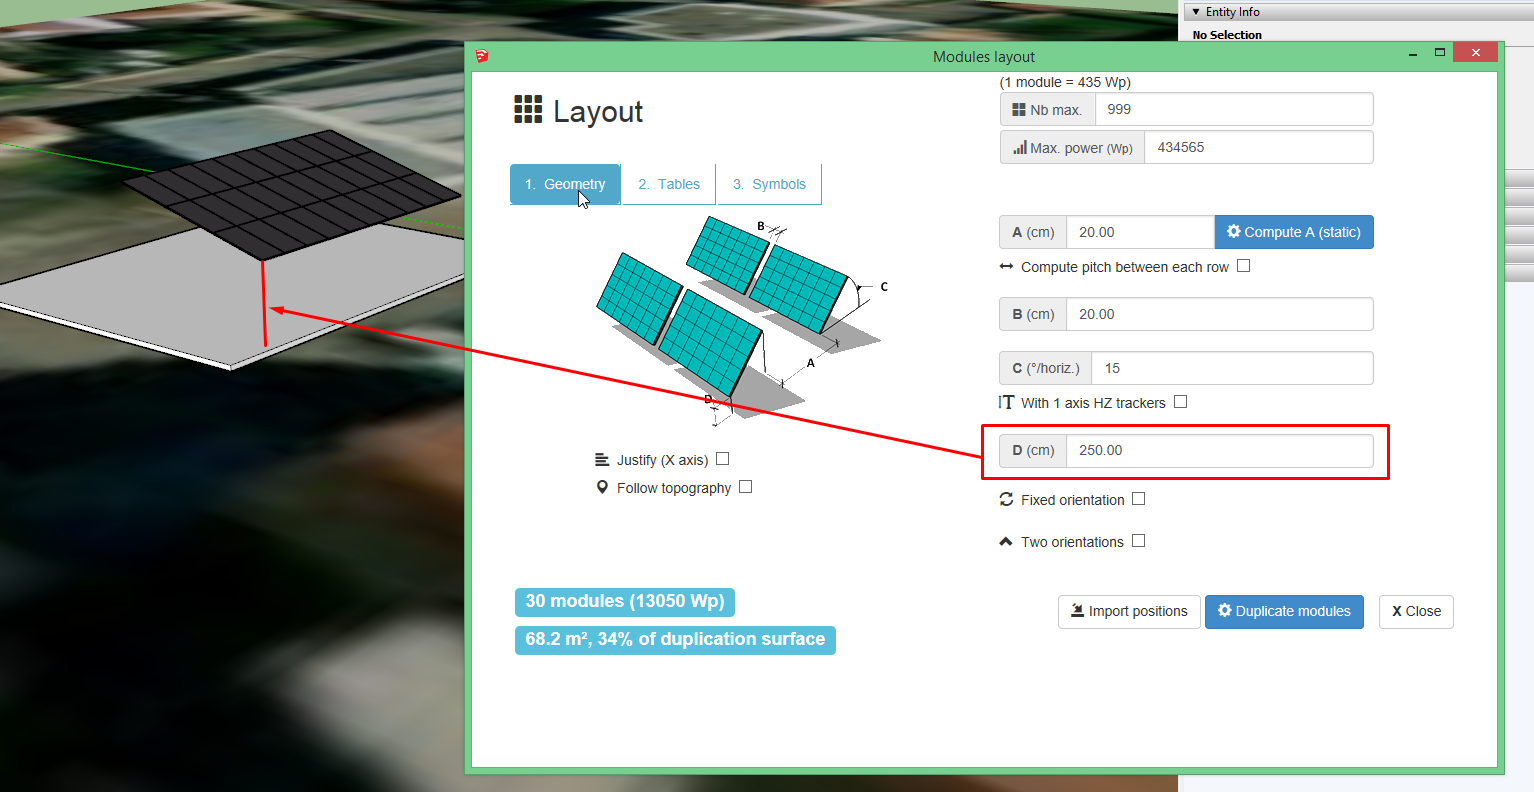
- Above all, do not create the tilted surface to duplicate the modules
Then, create your project, such as any other project. The gains from bifacial modules will be calculated in the 'Production' section. 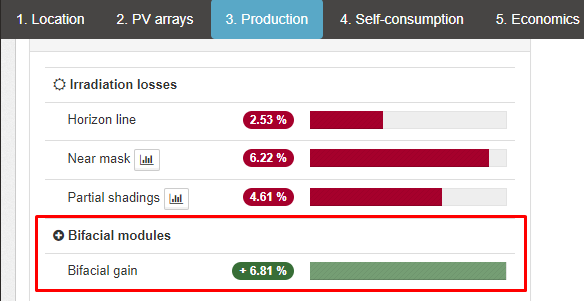
There are also some parameters in the 'Parameters' tab to fine-tune the simulation 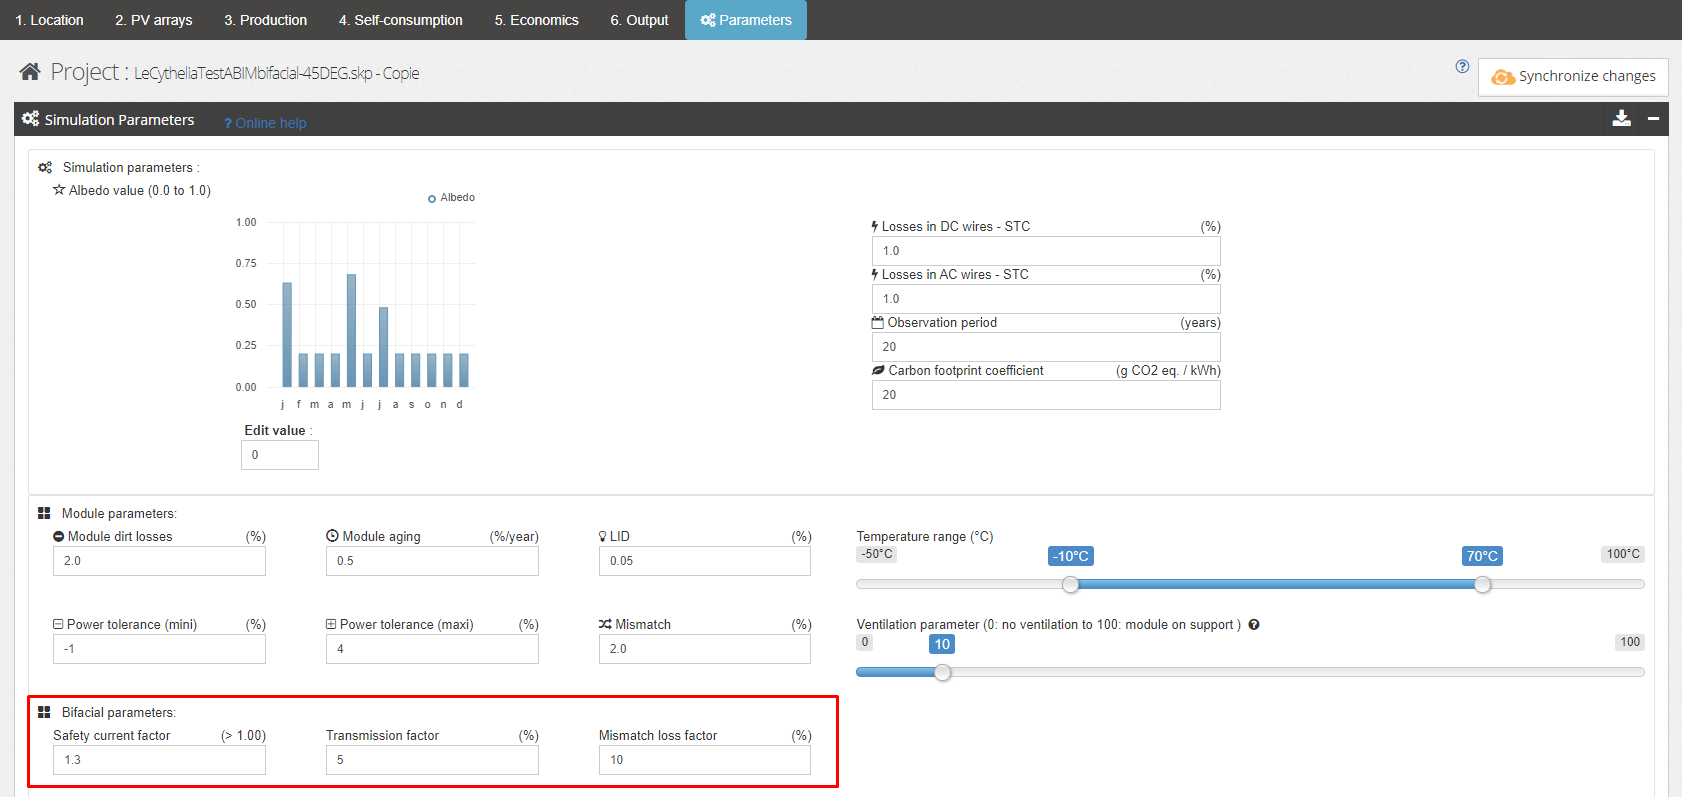
How can I see how an MPPT works? MPPTcurvePV
This feature is only available with a 3D project.
To see the P(V) curve of an MPPT, please select an MPPT in the 3D view and choose your month and time in the 'Production' sub-tab
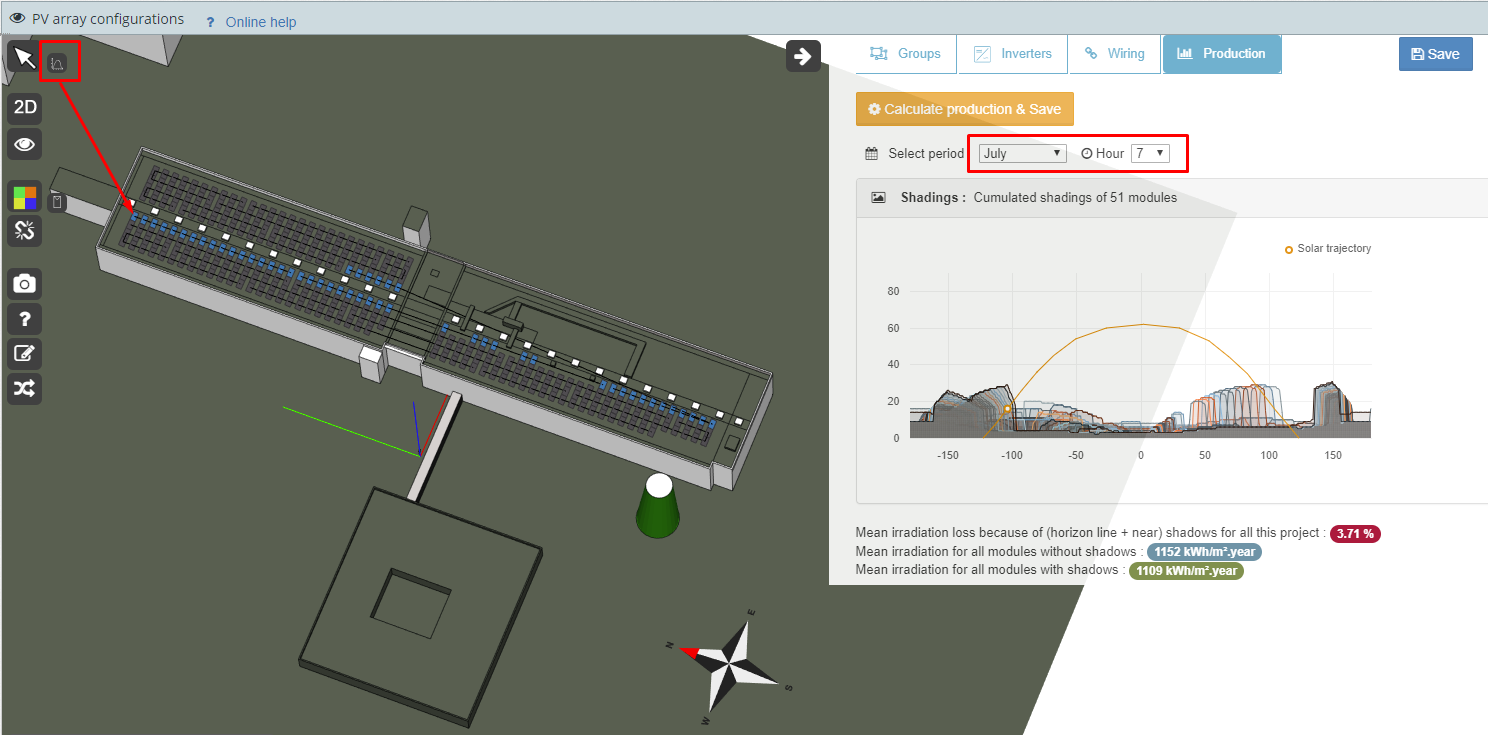
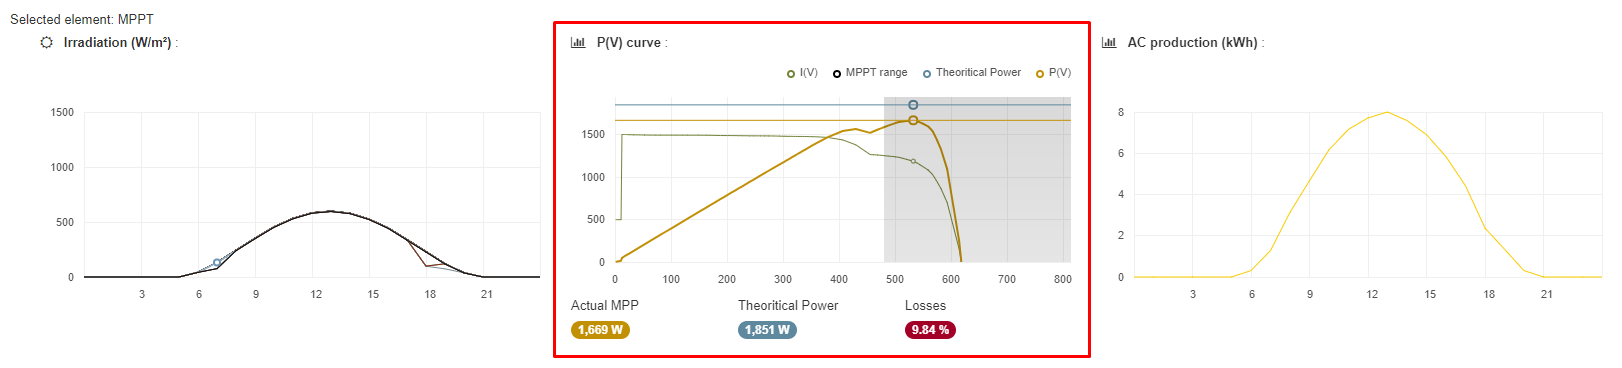
You can see all the shading for the modules that are wired to the selected MPPT.
Below, you will have access to the P(V) curve. In this case, there is a 9.84% loss compared to the theoretical power.
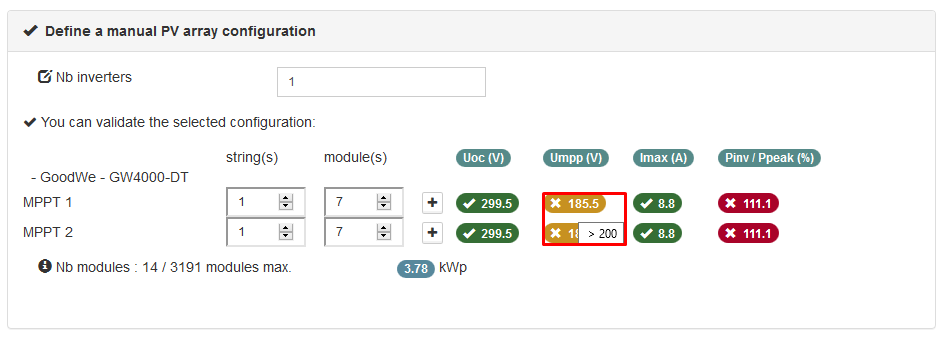
Properly sizing the inverter is highly important for the safety of the system and for producing energy.
For example, the voltage per string in this project is invalid (red indicator).
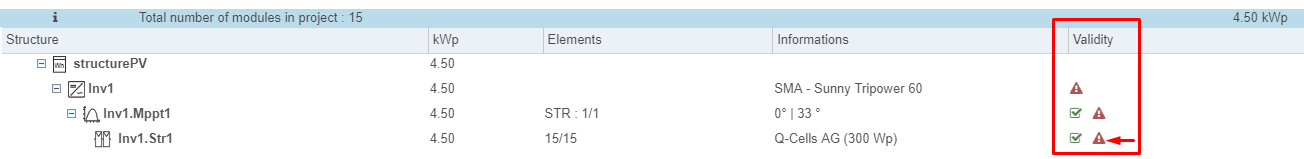
archelios simulates production and therefore simulates each MPPT with its voltage. In this case, the modules do not produce enough energy for the voltage to be sufficient for the inverter to generate power.
For a clearer idea, here is the curve of an MPPT for the month of January at 12 pm (only available with a 3D project)
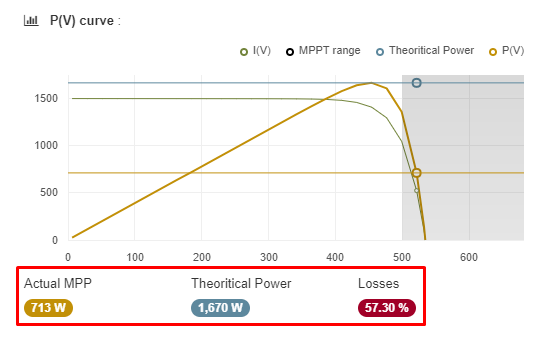
Instead of producing the theoretical maximum power of 1,670 W, this MPPT only delivers 713 W. This value corresponds to the maximum power point found on the curve in the MPP voltage range.
The contrast is more significant in the example when using the same time in July because the voltage of the modules is even lower (due to heating in the modules).
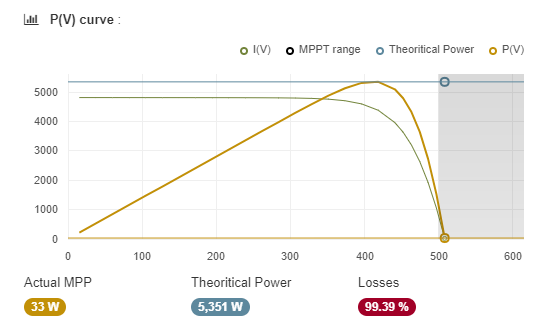
The whole curve is outside the MPP voltage range (which starts at 500 V).
The performance ratio will be very low due to the incorrectly sized inverter.
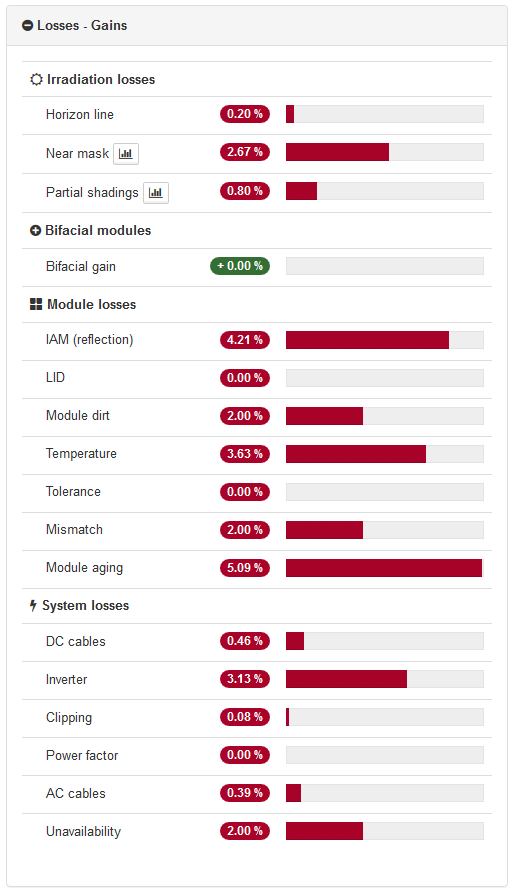
How are losses calculated and displayed? displayLosses
Losses are displayed as a percentage in relation to the previous step and not generally over the entire project.
For example, inverter losses are calculated in relation to the energy arriving in the DC cables and not through irradiation of the modules. These are relative percentages.
As for the performance ratio, our calculation takes into account more than the system. It takes into consideration the shading and IAM losses.
How do I manually recalculate the performance ratio? recalculatePerformanceRatio
First, the performance ratio is the ratio between the specific energy yield and the annual incident irradiation in the module plane. The performance ratio's calculation takes into account more than the system. It takes into consideration the shading and IAM losses.In other words, it is not the displayed losses that allow us to calculate the performance ratio but the production results through the energy yield.
The performance ratio cannot be found with the losses because these losses are an average across all the modules and inverters over the entire observation period. The losses at the start of the commissioning period will not be the same as at the end. They are displayed relatively since this provides an overview of the losses to optimise the installation.
To define the performance ratio, use this formula: a specific energy yield/irradiation in the module plane with horizon shading.
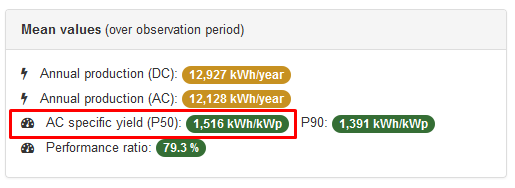
Since the formula has to be performed for each array, it is a problem when there is several inclinations or orientation.
The irradiation in the module plane is given for guidance only in the 'Site' section
For example, if you have two tilt angles: 13° (for 1,770 modules or 37% of the plant) and 32° (for the rest), which gives:
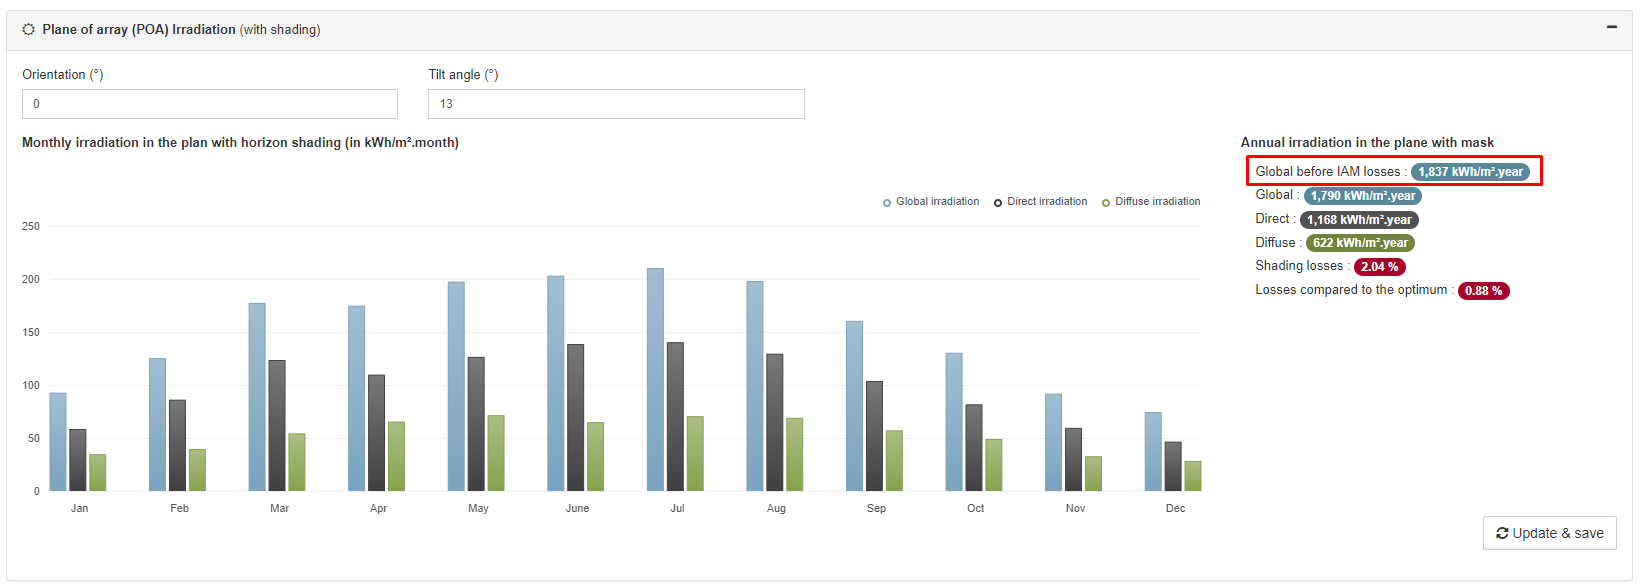
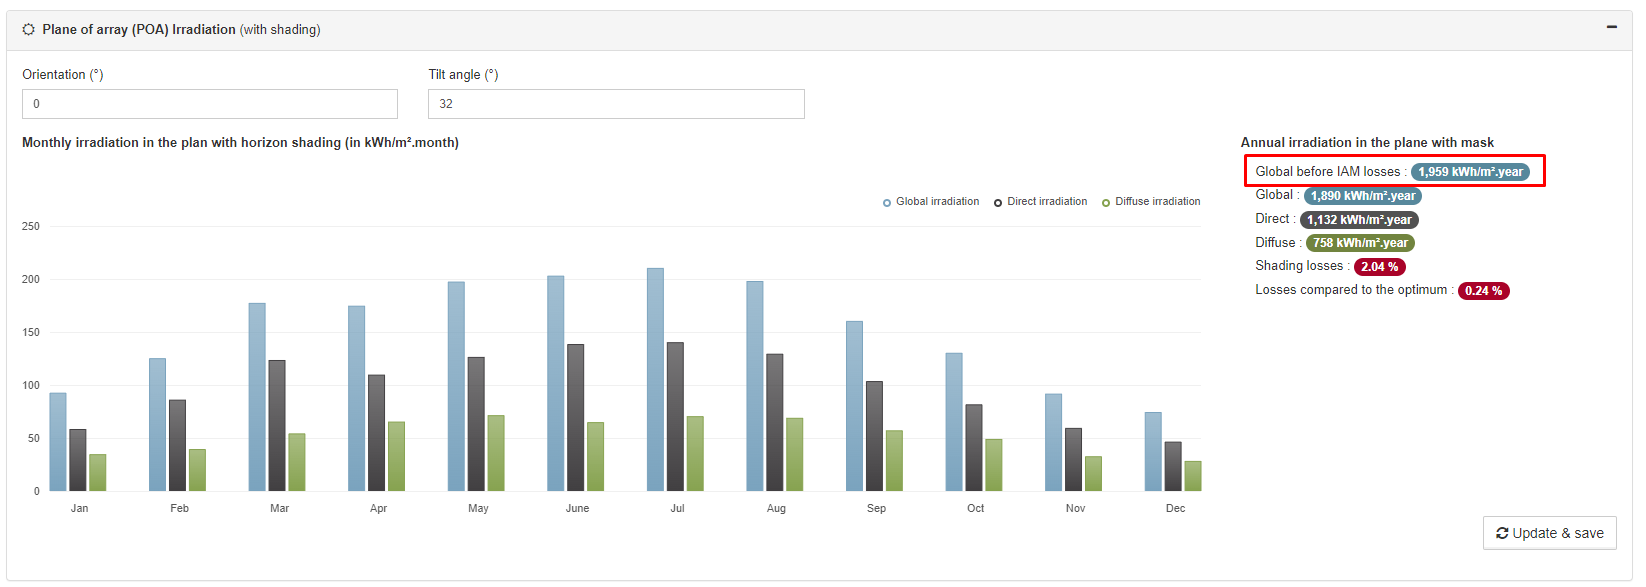
1516 / 1837 = 82.53%
1516 / 1959 = 77.39%
With the distribution, this gives: 82.53 * 0.37 + 77.39 * 0.63 = 30.54 + 48.76 = 79.3% (performance ratio for the whole plant)
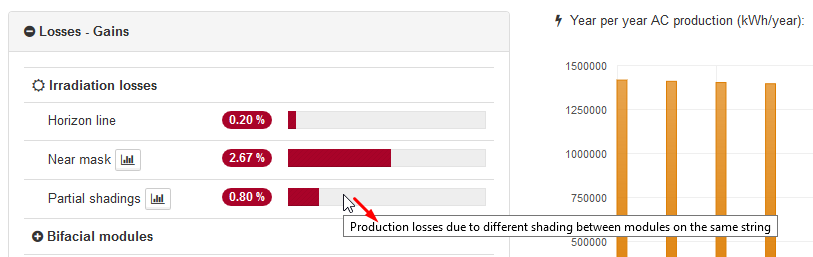
What is the difference between near-shading losses and partial shading losses? nearMaskPartialShadingLossesDifference
Near-shading losses are an irradiation loss on the modules.
Partial shading losses are caused by connecting shaded / unshaded modules in series, or modules with different orientations or inclinations in series.
A small tool-tip is displayed when you mouse over the % loss bar
Can I save the simulation parameters for processing the project faster? saveSimulationParameters
Yes, you can save the simulation parameters.
From the archelios software :
From the archelios plug-in on SketchUp

These parameters will therefore be copied from one study to another.
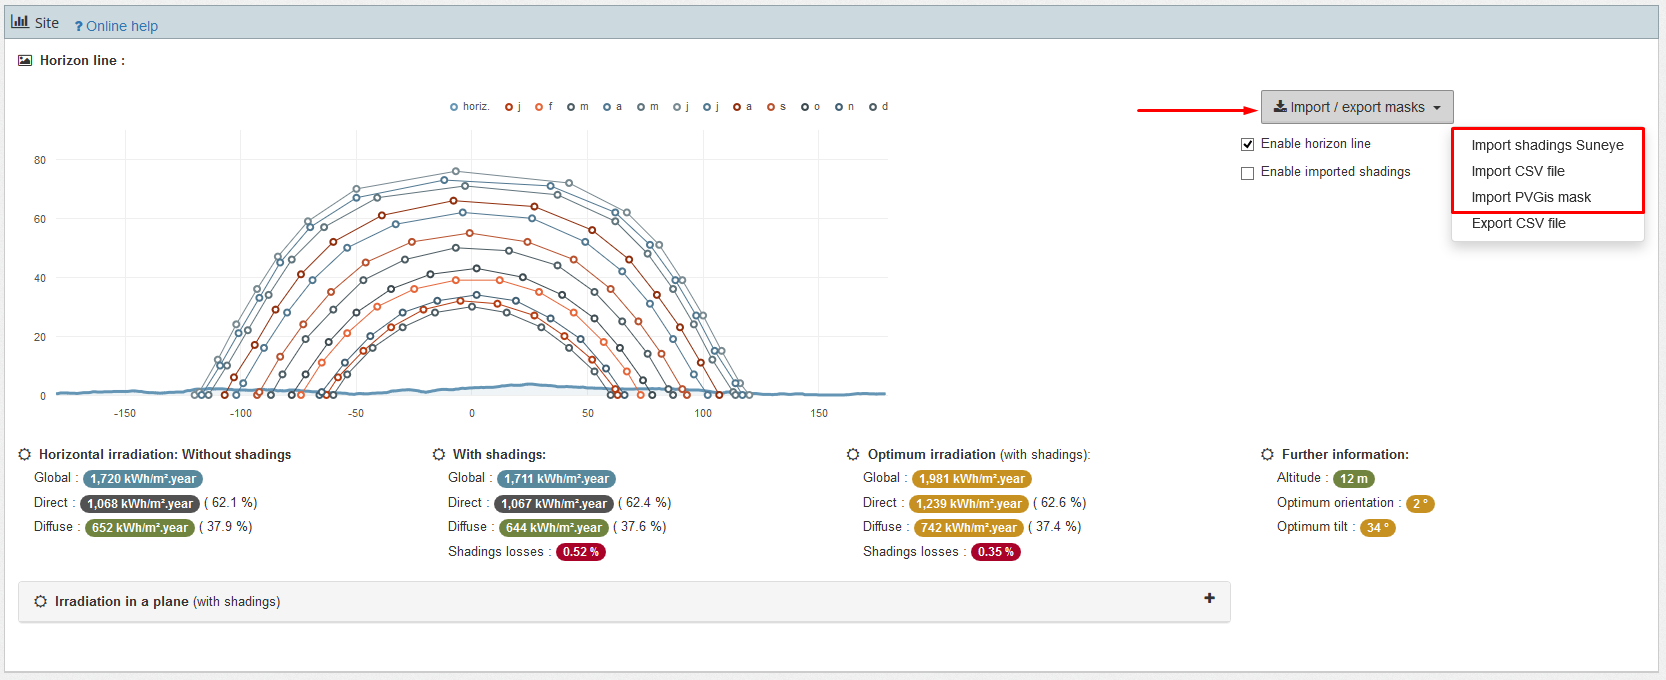
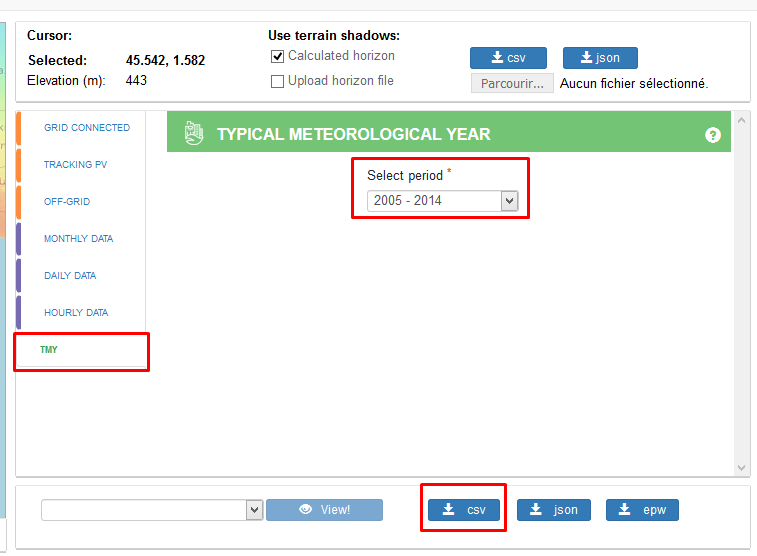
How do I import my shading file? importShadowsFile
When you confirm your address, horizon shading is automatically calculated in archelios. archelios uses data from NASA.
You can still import your file with the import button
Here are some template files you can download:
An installation (comprising around 130,000 modules) can be divided into groups (usually into transformer groups) The raw results can then be duplicated for the global calculation (CSV file) or the AutoCAD plan (DXF format).
The procedure for this type of design is as follows :
-
Create a group for the plant (either 1 MWp or a transformer group) and export the project to archelios Pro. Configure the project (inverters, wiring, etc.) and calculate the power production.:
-
Create a new project without 3D directly from archelios PRO:
-
Add modules and inverters:
-
In the Production section, click on 'Import losses' and select the previous project:
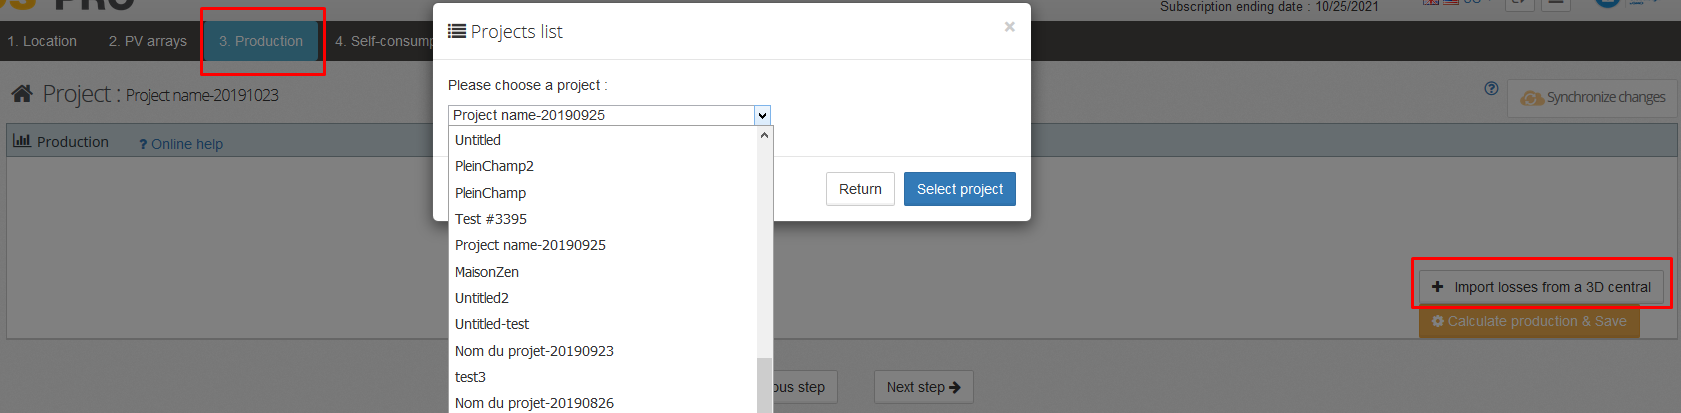
-
Calculate the production and save the project. This calculation will give more accurate results.:
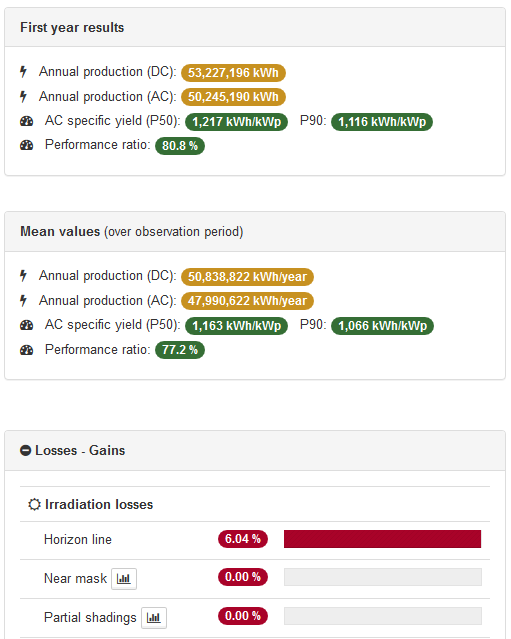
Without an imported shading profile
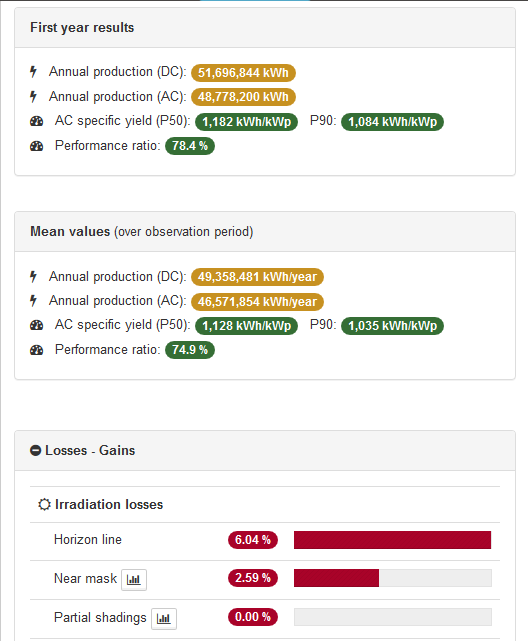
With an imported shading profile
archelios PRO delivers many export options for designing the next stage of the project, including CSV (Excel) and DXF (AutoCAD).
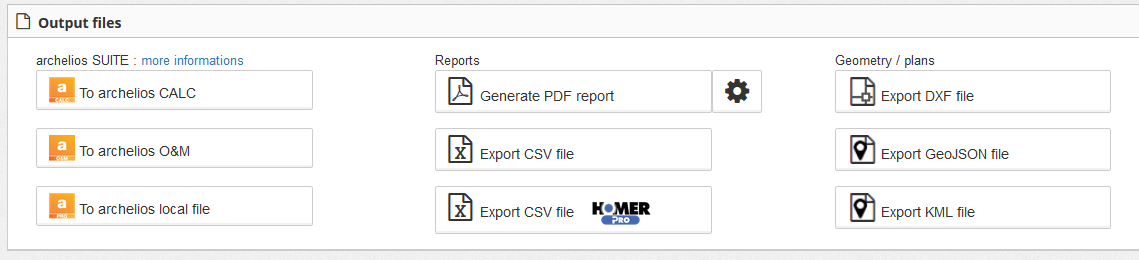
The CSV export provides raw data and calculation results for the entire plant.
When a project is designed in sections to allow for wiring and fast calculation, all the project sections can be joined together in AutoCAD using the DXF export feature. This saves time without losing any precision in the calculation results.
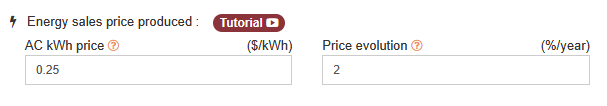
Self-consumption - Economics
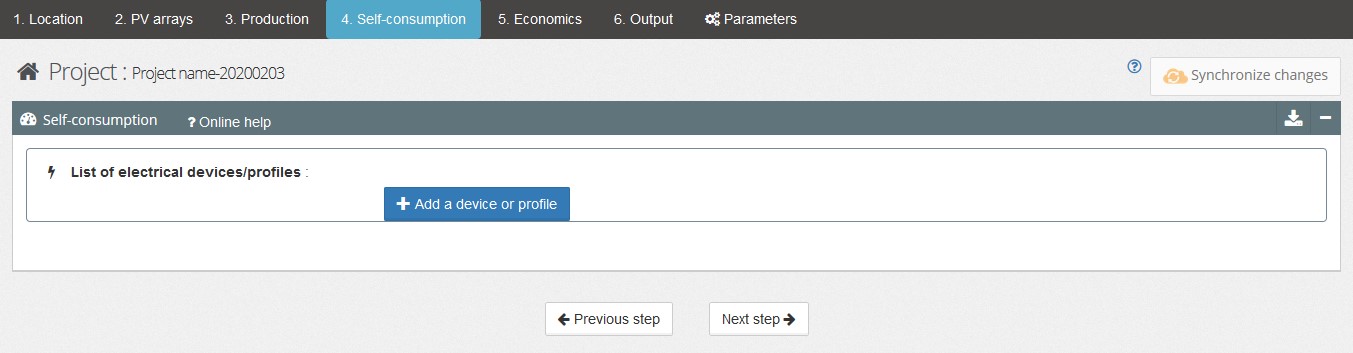
How can I simulate a project with self-consumption? selfconsumptionSimulation
The self-consumption section is available in the 'Self-consumption' tab
Can I import measured data for self-consumption? importProfileFile
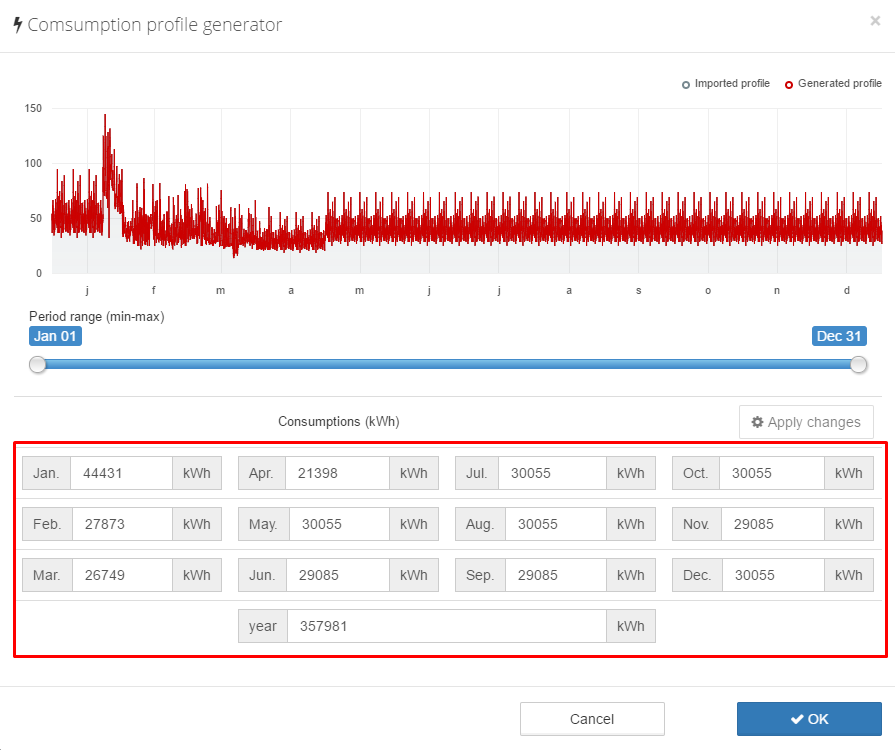
If your file does not cover a full year, you can choose a partial import that will allow you to spread your measurements over a full year.
archelios calculates an average week with all the measured points, which are then spread over the year.
If this uniform distribution method is not suitable for your project, you can spread your electricity consumption on a month-by-month basis.
It is also possible to import a real load curve from Enedis in the following way:
Add average Enedis profiles based on current consumption by profile type.
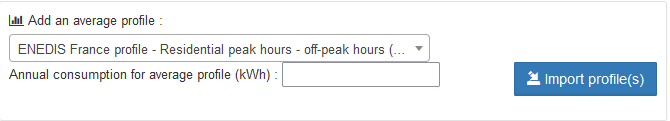
Add electrical equipment profiles based on the usage habits of this equipment. Several profiles can be imported at once by pressing the Ctrl key.
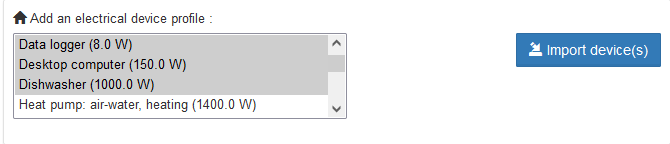
It is also possible to create a profile completely
- Enter the name of the equipment

All consumption profiles can be modified after import. (See section:editConsumptionProfile)
How do I edit my consumption profile? editConsumptionProfile
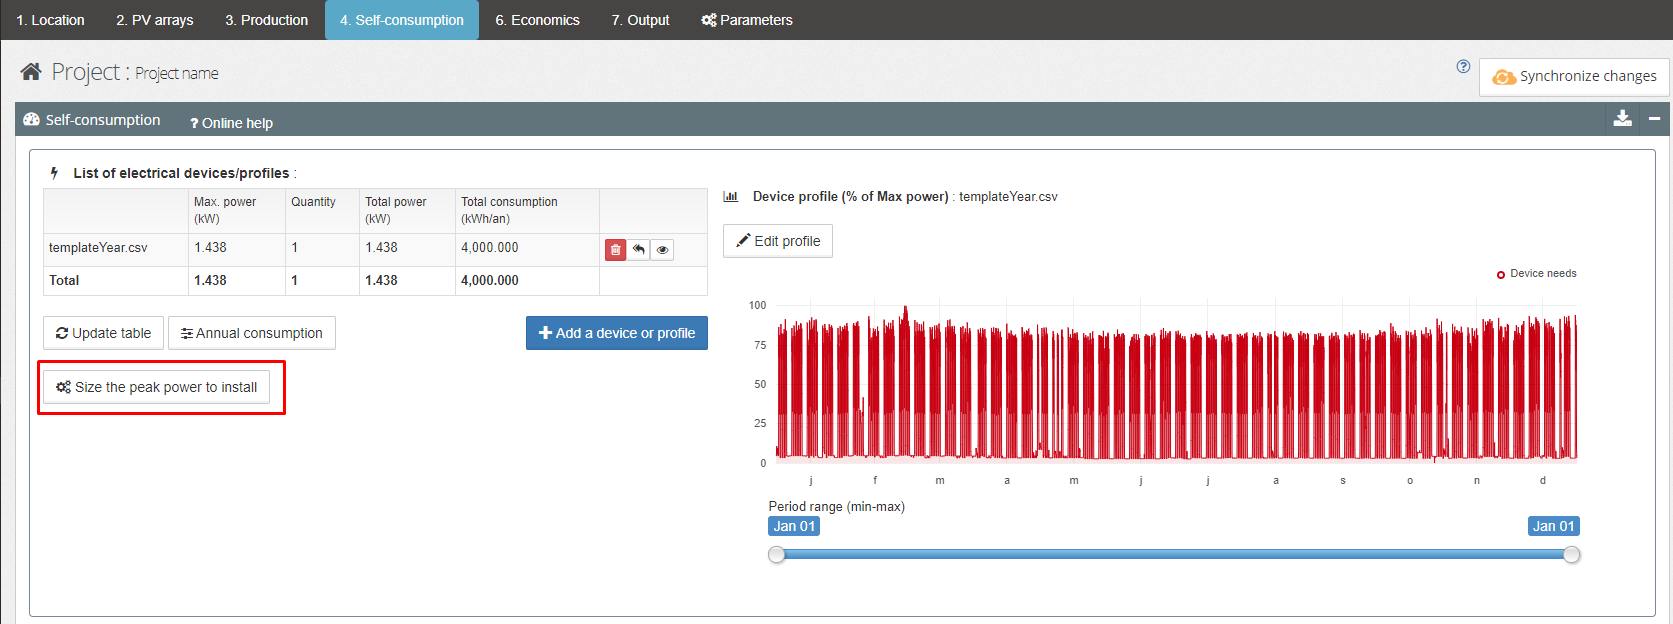
How can I know what peak power I should install to cover X% of my consumption? sizingPeakPowerDependingConsumption
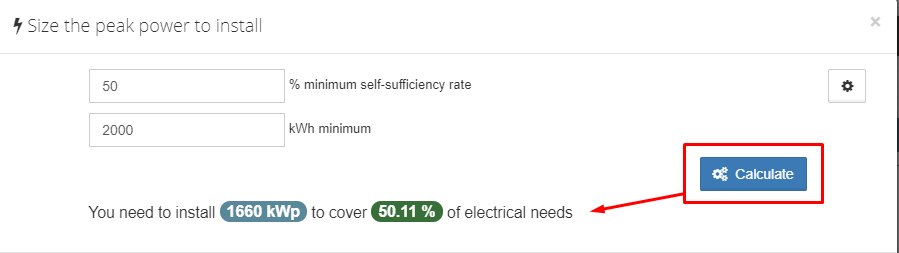
You can automatically calculate the minimum peak power that needs to be installed to fulfil a minimum % of your electrical needs with the photovoltaic electricity produced.
Click on the 'Size the peak power' button in the 'Self-consumption' tab
Enter your self-production rate or the kWh that you want to consume by photovoltaic electricity. Confirm a value with the 'Enter' key to automatically calculate the second value.
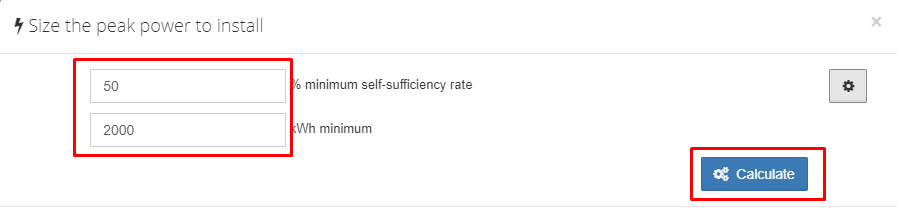
Click on the 'Calculate' button to start the calculation.
The result is displayed below
If the resulting rate is less than the value entered, you can go to the advanced settings to increase the power range used for the calculation
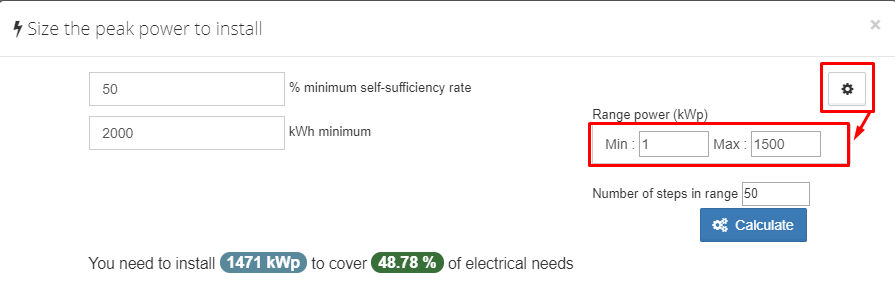
You can also change the number of steps in the calculation: the higher the number, the greater the accuracy will be for the power that needs to be installed, but the calculation will take longer
For example, you consume 4,000 kWh of electricity per year. Of the 4,000 kWh, 2,000 kWh are photovoltaic electricity produced by your modules. Your photovoltaic self-production rate is equal to (2,000 kWh (self-produced electricity) / 4,000 kWh (total consumption)) x 100 = 50%.
This self-production rate shows the savings that you will achieve with a photovoltaic self-consumption installation. With a photovoltaic self-production rate of 50% (in the previous example), you will halve your electricity bill.
How do you adapt the average electric consumption profiles by the actual annual consumption indicated on the bill? adaptProfilesToAnnualInvoice
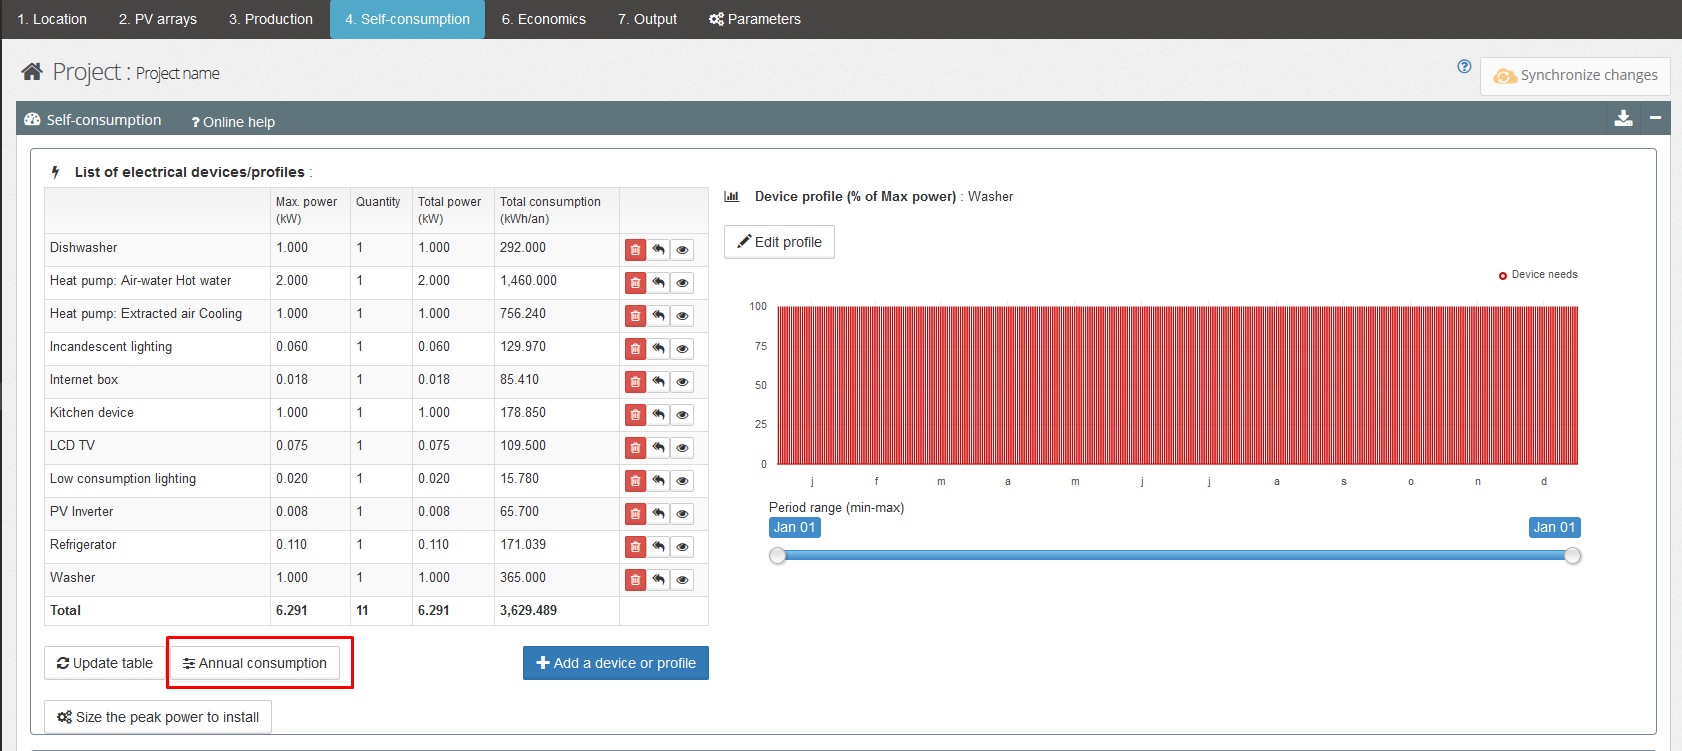
You can adapt all the average profiles for the devices to the overall annual consumption indicated on the bill.
Click on the 'Annual consumption' button after choosing all the electrical devices.
Enter the overall annual consumption and click on the 'Validate' button
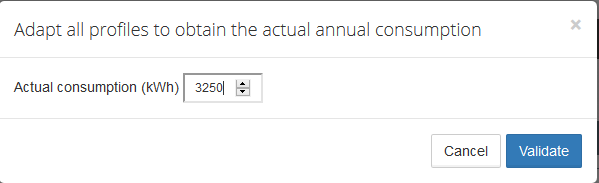
All the profiles are adapted in power to match the actual annual consumption.
Yes, you can display the costs in euros or any other currency. To do so, go to the 'Economy' section and enter the input value for the currency
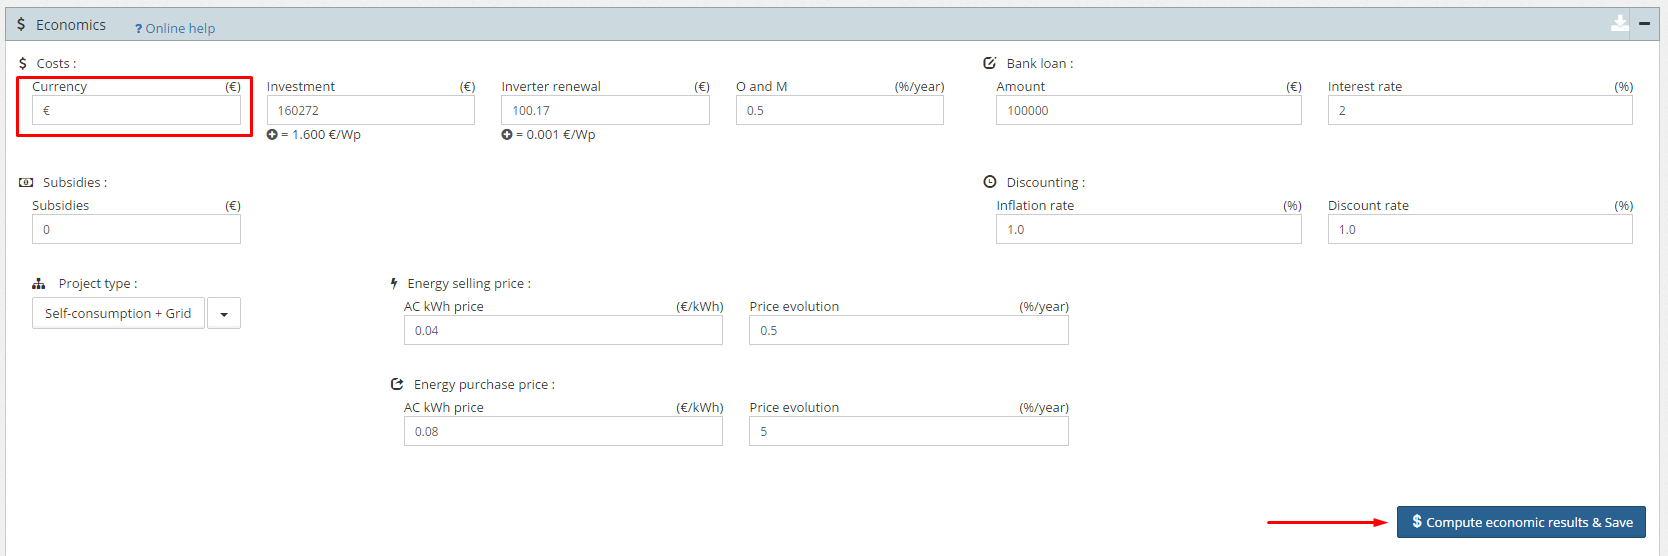
Remember to confirm the change by clicking on the blue 'Compute economic results' button
Economic optimisation of peak power with self-consumption optiEcoPeakPowerSizing
This feature can be used to define the peak power to be installed for greater profitability according to a minimum self-consumption and self-production rate
Click on the 'Optimisation of self-consumption' button to open the window 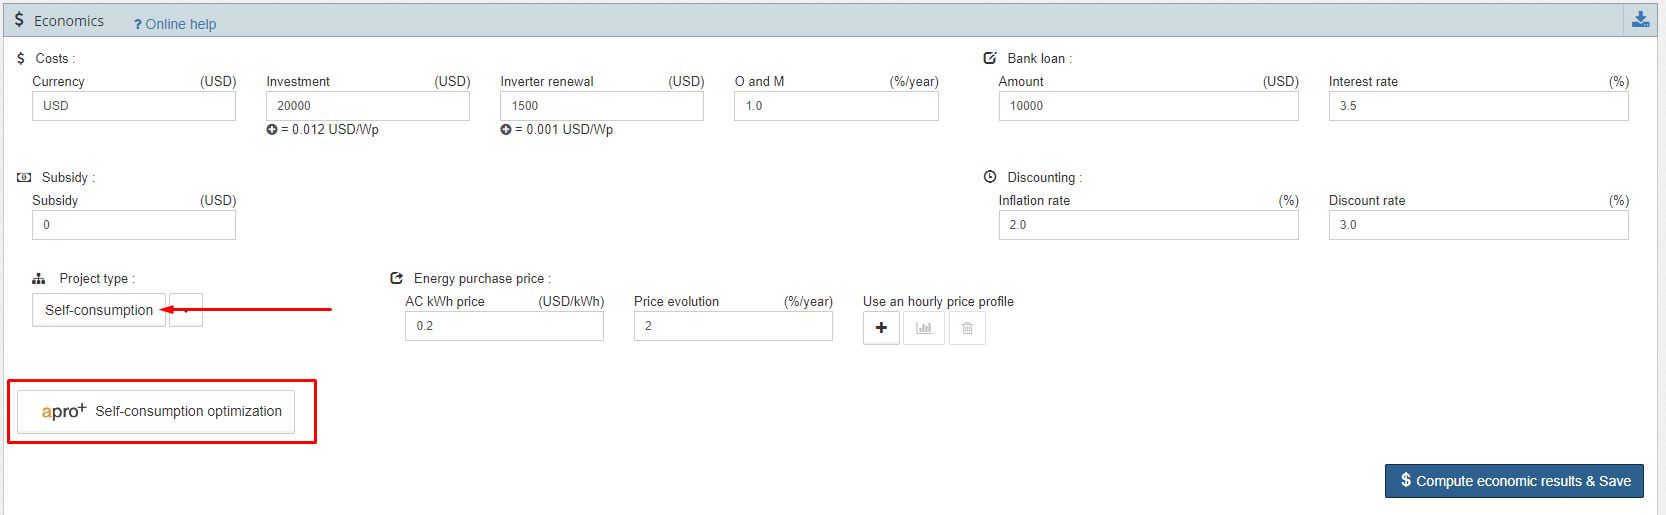
You can adjust the minimum percentage settings for the self-consumption and self-production levels required for this project
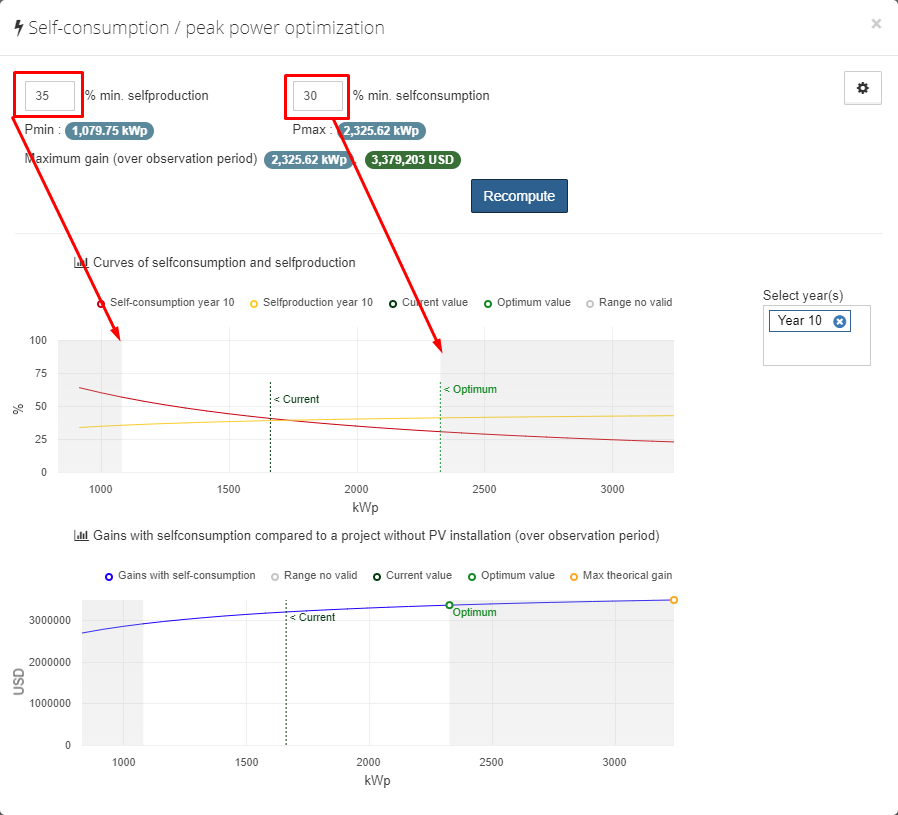
Valid data are represented in the graphic with a white background. The grey areas on the left and right represent invalid peak power values in relation to the required self-consumption and self-production rates. Depending on the project, these grey areas might not exist or, on the contrary, may cover everything.
You can also adjust some parameters such as the minimum and maximum kWp for the calculation. The range is limited by default for performance reasons.
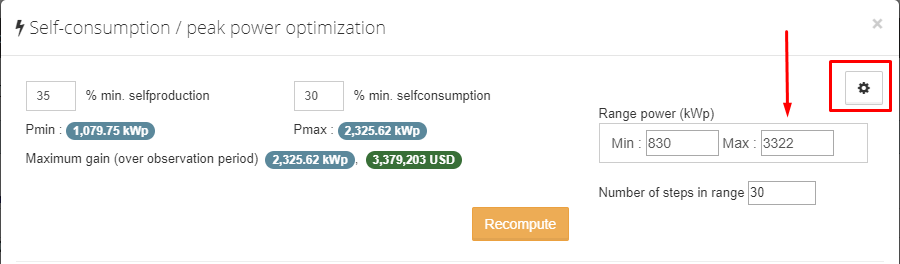
The calculation is based on a profile of a kWp, which itself is calculated from the current project.
The first graphic represents the self-consumption and self-production rates for each peak power. The current line represents the performance of the current project, and the optimum line represents the optimum performance based on the calculation.
In this case, you can clearly see that the last valid value for achieving the minimum self-consumption rate is 2,325 kWp with 30.57%. The next calculated step will have a self-consumption rate of less than 30%. 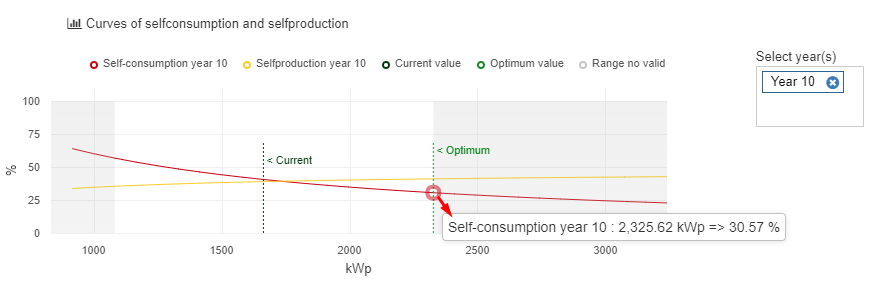
Year 10 is selected by default, since the archelios calculations use the average values of the observation period (20 years by default).
The second graphic is used to represent the differential NPV between a PV-free project (all the electricity needed to fulfil needs is purchased from the grid) and a self-consumption project.
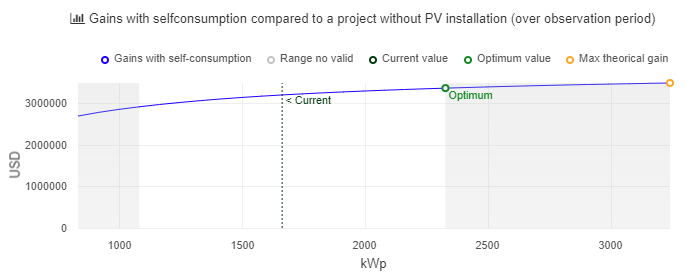
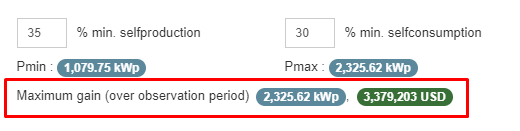
The maximum gain calculated in accordance with the self-consumption and self-production rates is displayed at the top.
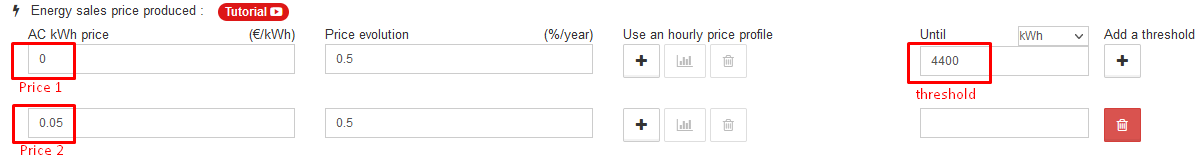
Can I use hourly prices for buying or selling electricity? importHourlyPricesProfile
If your file contains 24 values or less (24 hours), this 'typical' day will be replicated on all other days of the year.
If your file contains between 25 and 168 values (168 hours equal one week), this data will be replicated every 7 days of the year. This will be considered a 'typical' week.
If your file contains over 168 values, this data will be taken as it is in the year.
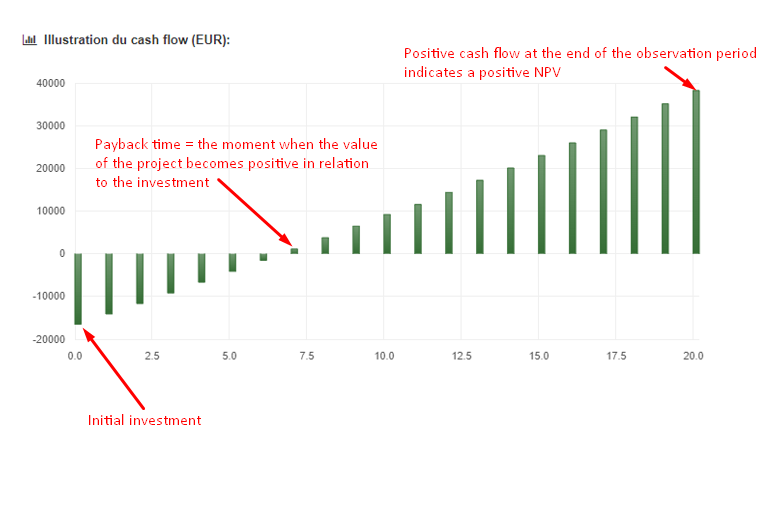
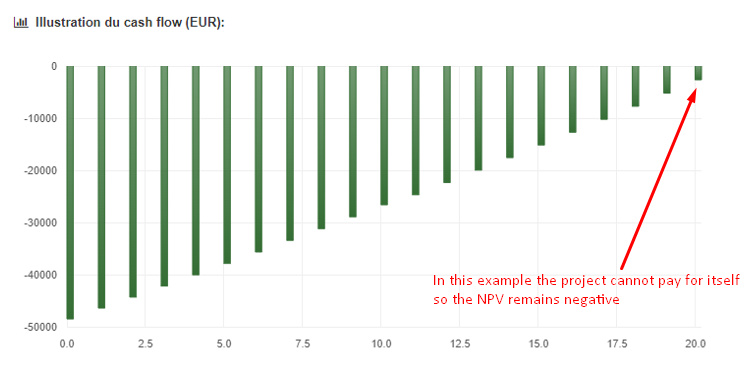
How are the economic profitability indicators calculated? economicIndicators
The calculations in archelios PRO are based on a number of project-related economic analysis principles, namely:
In archelios PRO, the economic calculations are discounted to see the NPV. This value automatically takes account of the WACC. If it is positive, it means that the project (including its financing) is profitable in relation to the investor's expectations.
The discounted payback time refers to the amount of time required for income to compensate for the initial investment and annual expenses. If the payback time is within the observed period, the NPV will be positive and the project is considered to be profitable.
The project's IRR is independent of the discount rate, because it is the rate that can be used to obtain a zero NPV. A project is profitable if the IRR is greater than the discount rate.
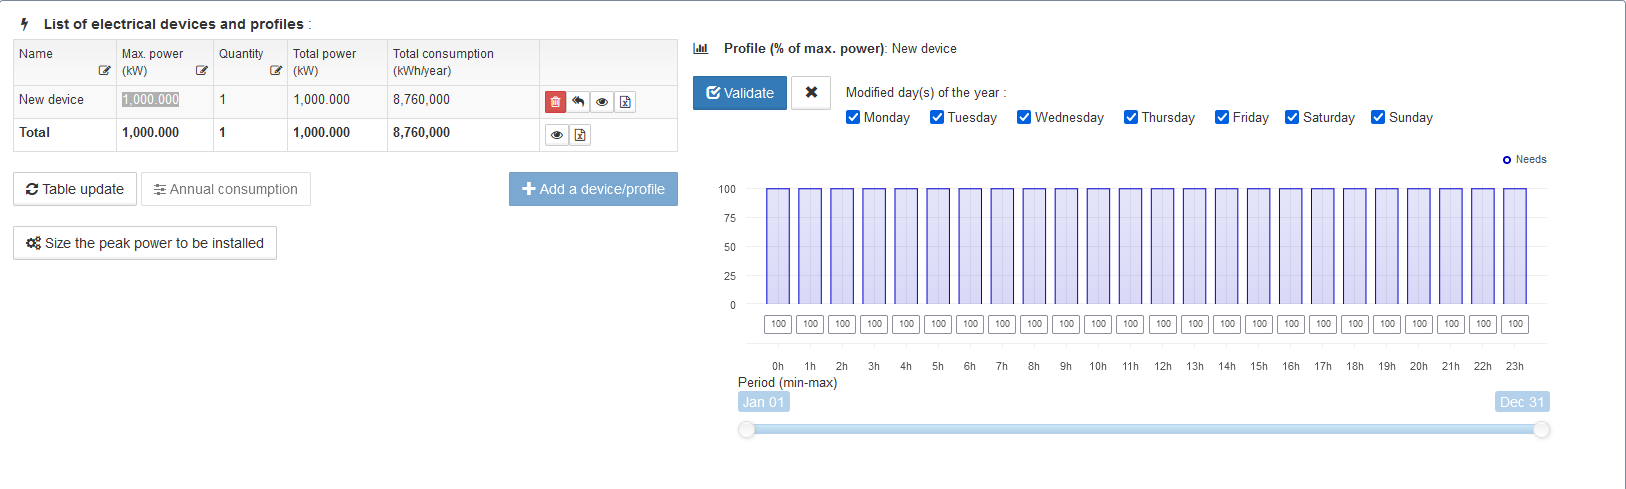
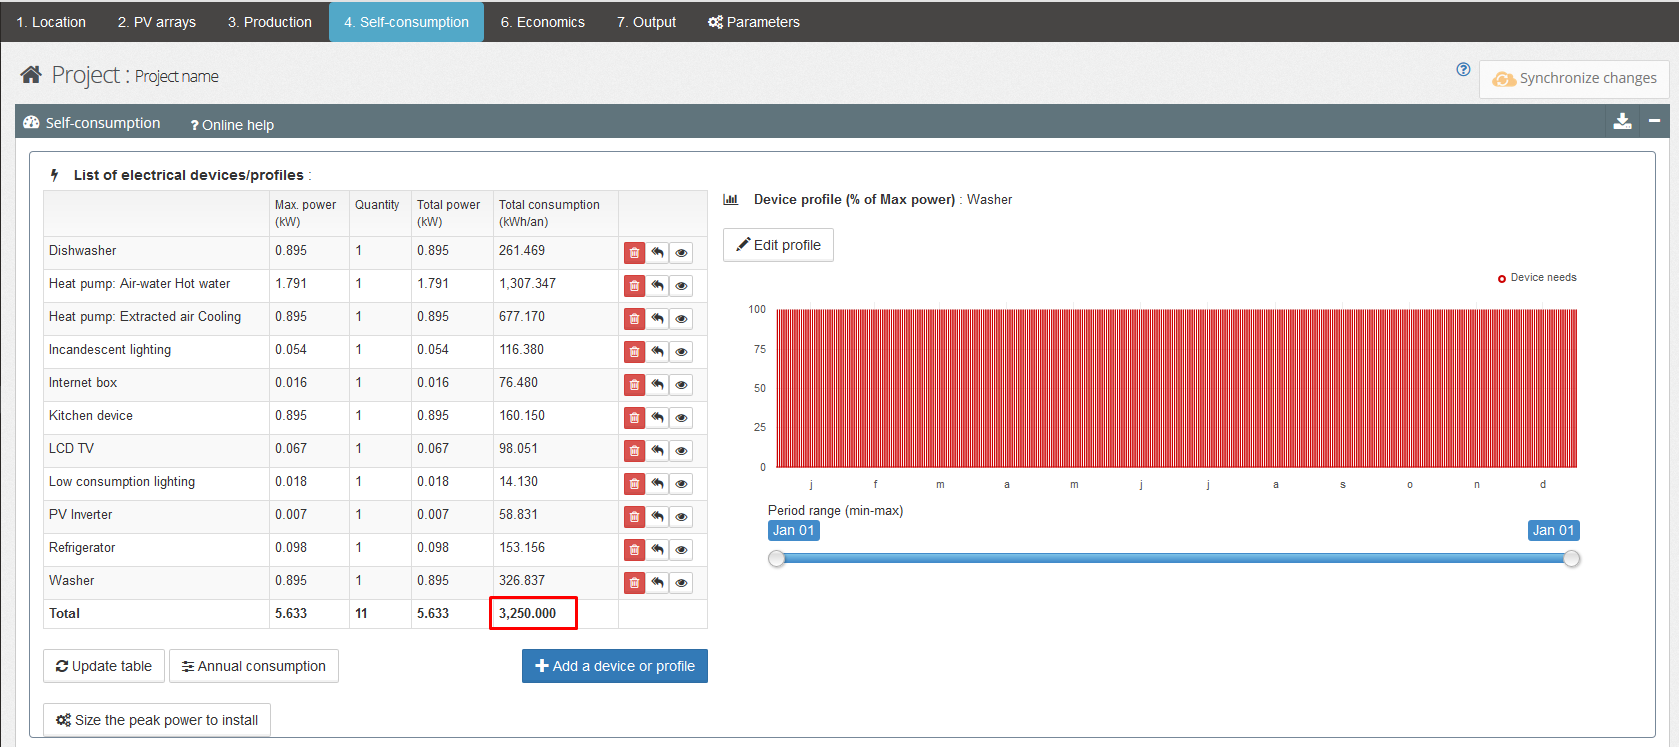
How the list of electrical devices and profiles works ? elecDeviceWork
The different electrical profiles are integrated into a table whose first three columns are customizable:
- Profile name
- Maximum profile power
- Number of similar profiles in the installation
After modifying a value in the table, click on Update table to calculate the annual consumption.
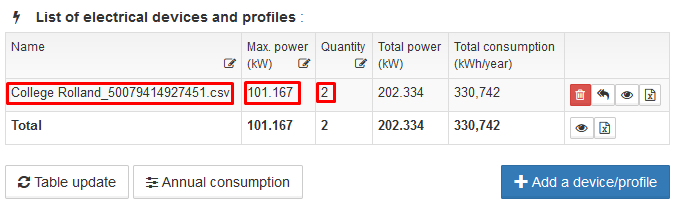
* Values framed in red can be modified directly in the table
Delete a profileDuplicate a device or profile
Show the profile in the chart to view or edit it.
Export a device or profile
How does the energy storage part work? energyStorage
Energy storage makes it possible to increase the installation's self-consumption rate through the physical or virtual storage of energy produced and not consumed during the day.
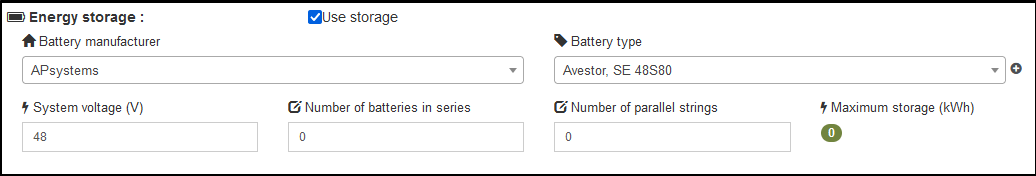
In this case, the excess production is stored until the batteries are full, then the surplus is reinjected into the electricity grid.
It is possible to manually enter the battery configuration :
- Select battery manufacturer and model
- The number of batteries in series
- The number of parallel chains
* Connecting batteries in series or in parallel has no impact on the energy flow calculations. Verification of the compatibility of the battery voltage with the operating voltage of the charger/inverter is independent of this study and remains the responsibility of the user.
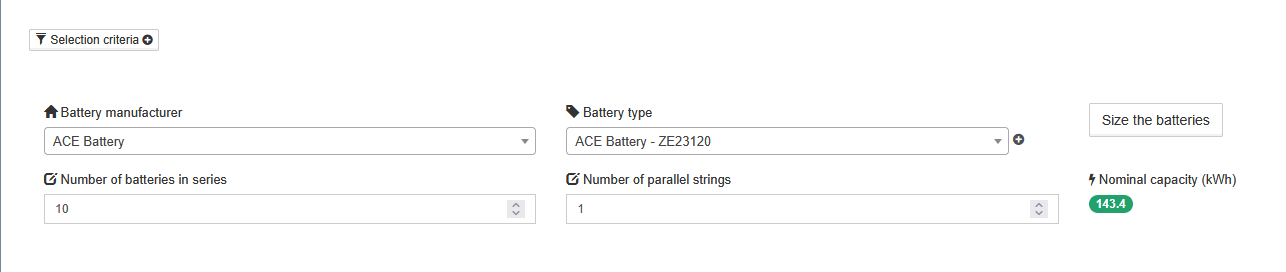
The maximum storage in kWh is then calculated from these elements.
With a GOLD subscription, it is possible to size the storage according to the desired number of hours of autonomy*:
- Select the battery manufacturer and model
- Click on the size batteries button
* Battery sizing is based on maximum demand over the defined period, assuming full batteries, and taking into account the minimum and maximum state of charge assumptions entered by the user.

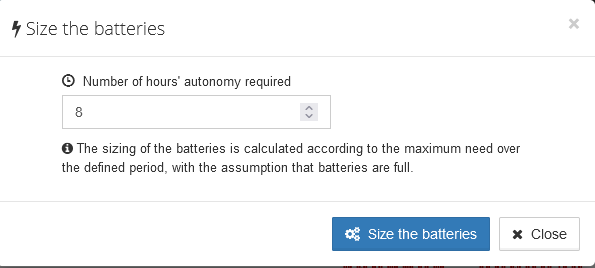
- Enter the desired number of hours of backup time and the system voltage*
- Click on Size Batteries
* The system voltage corresponds to the voltage that the inverter/charger can support.
The configuration is automatically populated based on the maximum storage capacity required to meet the backup time requirement.
How to use advanced storage settings? advancedSettingsStorage
Advanced settings allow you to precisely configure the battery operation.
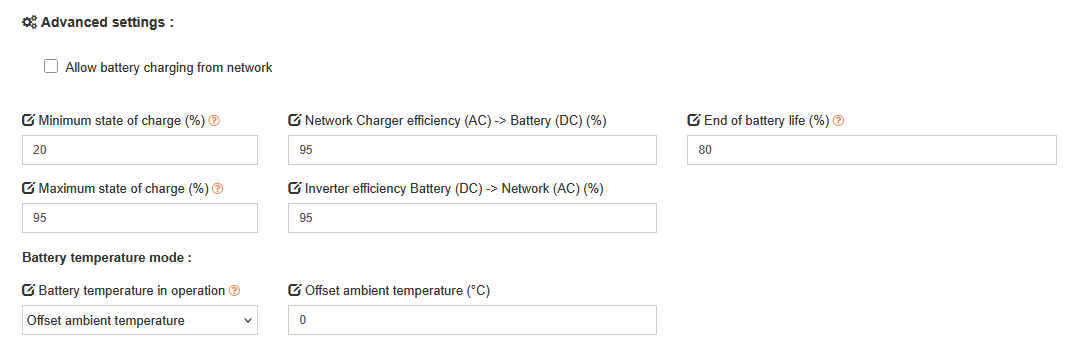
Batteries tend to degrade more quickly when they are fully discharged or fully charged. It is therefore best to maintain the charge within the manufacturer's recommended range.
This range can be defined through the minimum state of charge, which prevents the battery from completely discharging (deep discharge), and the maximum state of charge, which allows charging to be stopped before the battery is fully charged.
These parameters are provided in the technical documentation and/or can be configured on the storage system.
Archelios allows you to enter the forward efficiency through the Charger Efficiency (AC) -> Battery (DC) parameter and the return Inverter Efficiency (Battery (DC) -> Grid (AC) parameter.
This data must be available in the charger system's technical data sheet.
Battery end of life can be entered in archelios PRO to take its renewal into account in the self-consumption analysis. This is the percentage of the initial capacity (called SOH for 'State Of Health') below which the battery is considered to be at the end of its life and must be replaced.
Battery temperature is used to calculate the battery's calendar aging and usable capacity, as it decreases with increasing temperature.
The user can choose between a fixed temperature, for use in an air-conditioned room, or an average annual ambient temperature with an adjustment entered by the user (default choice).
Is it possible to charge the batteries from the network? BatteryChargedFromNetwork
Charging from the grid allows energy to be stored from the electrical grid, only when the battery is not discharging.

It is possible to configure charging periods from the network using an hourly graph.
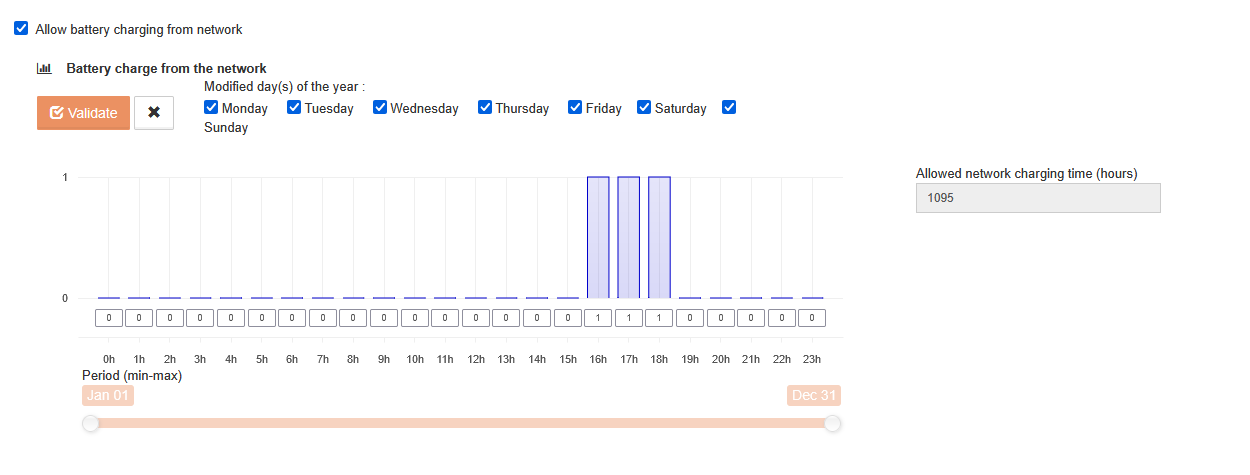
* As intelligent load management (EMS) is under development, determining the optimal periods when charging from the network is permitted remains the responsibility of the user.
How does virtual storage work? BatteryVirtual
In the case of virtual storage, excess production is injected into the electricity grid to be stored virtually and released later when needs exceed production.
The sole data required for the calculation is the virtual storage capacity in kWh, which can be infinite.
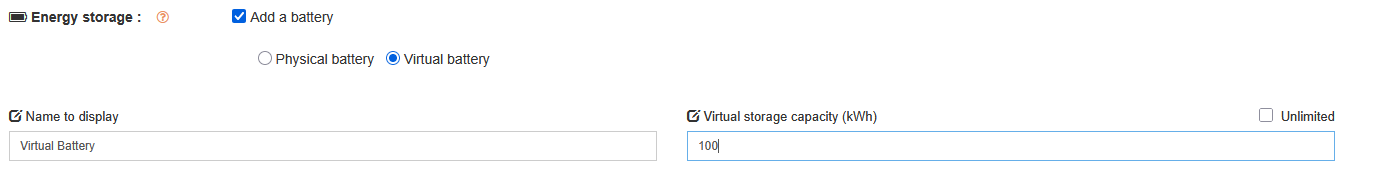
Like physical storage, this allows for increased self-consumption and self-production rates.
* The valuation of virtual storage is managed through economic analysis.
What is the method for calculating physical storage? CalculBatteryPhysical
For physical storage, the calculation method is taken from the NREL System Advisor Model (SAM) software documentation.
If there is excess PV energy, the battery is charged from the PV and supplemented from the grid during the permitted periods. Otherwise, the battery is discharged. The grid charge is not processed while the battery is discharging. If there is no demand, the battery can be fully charged from the grid, still during the permitted periods.
The charging current is determined from the charging power (PV power – consumption) or discharging power (consumption – PV power), corrected for the charging or discharging efficiency, then limited by the maximum currents.
At each time step, the battery's relative state of charge (SOC) can be calculated.
After a year of simulation, the aging is calculated:
- Calendar aging, based on the battery temperature and the average SOC over the year. (With fixed or adjusted annual average ambient temperature)
- Cyclic aging, based on the number of cycles, the technology, and the average depth of discharge.
The aging for the year is taken as the lower of the two previous values.
Notable differences between lead-acid and lithium technologies
- The model describing the charge and discharge of lead-acid batteries is specific, they cannot charge or discharge as quickly as lithium batteries.
- The parameters of the model calculating voltage based on state of charge and current are specific to each technology (for example, the internal resistance is higher for lead-acid batteries).
- The Faradaic efficiency is different (Lead-acid: 0.8 / Li-ion: 0.98).
- The parameters of the cyclic aging model vary depending on the technology (a lead-acid battery degrades faster than a lithium battery).
- The variation in battery capacity as a function of temperature depends on the technology.
How to take into account the cost of storage? costOfStorage
For physical storage, the cost of batteries will have to be integrated into the economic analysis either in the total cost, the unit cost from the list of materials or through the average price, per peak Watt.
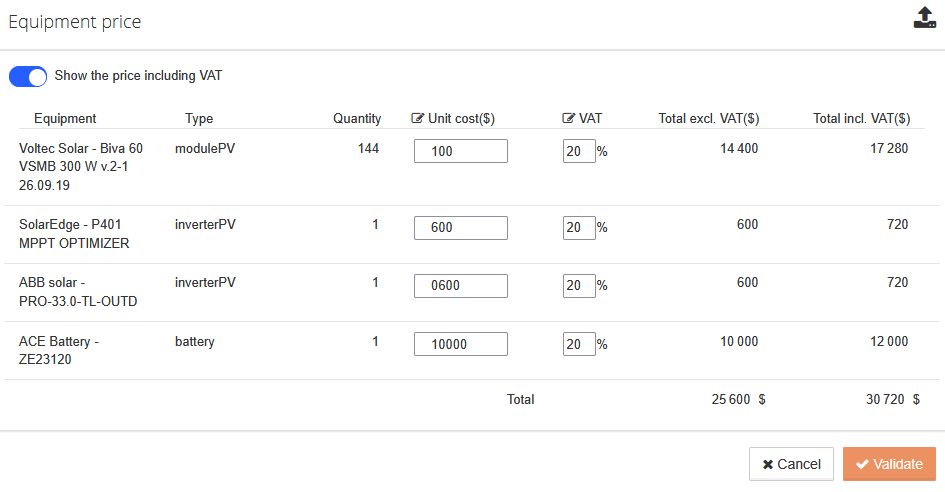
Depending on the duration of the simulation, the costs associated with battery renewal should be added to the maintenance and operating costs. (Visible from the battery degradation graph in the self-consumption analysis)
*Future developments will allow automatic battery renewal to be taken into account in the economic analysis.
How is the data in the results section generated? resultStoragePhysical
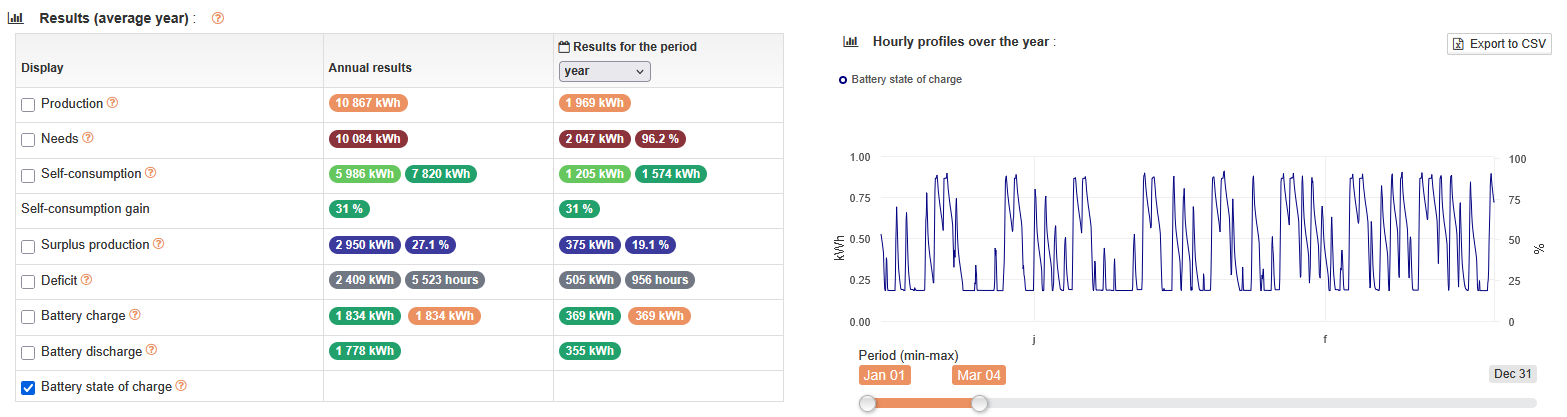
The results are partially displayed based on the checkboxes on the left, which allow for precise analysis of the various results. All checked categories are displayed on the graph and also present in the .csv export available above the graph.
-> Self-consumption gain: Self-consumption gain through energy storage.
Overproduction: Production that is neither self-consumed nor stored, and fed into the grid.
-> Percentage of unconsumed production
Deficit: Needs not covered by the PV installation + storage (physical) and transported from the distribution grid. Allows for the sizing of an external source in the case of sites not connected to the grid.
-> Number of hours where PV production cannot meet needs
Battery charge: Energy required to charge the batteries / Energy from the grid / Energy from solar (taking into account AC => DC efficiency)
Battery discharge: Energy released by the batteries (before DC => AC efficiency losses)
Battery state of charge: Display of battery charge/discharge sequences
The annual results present a summary of the analysis
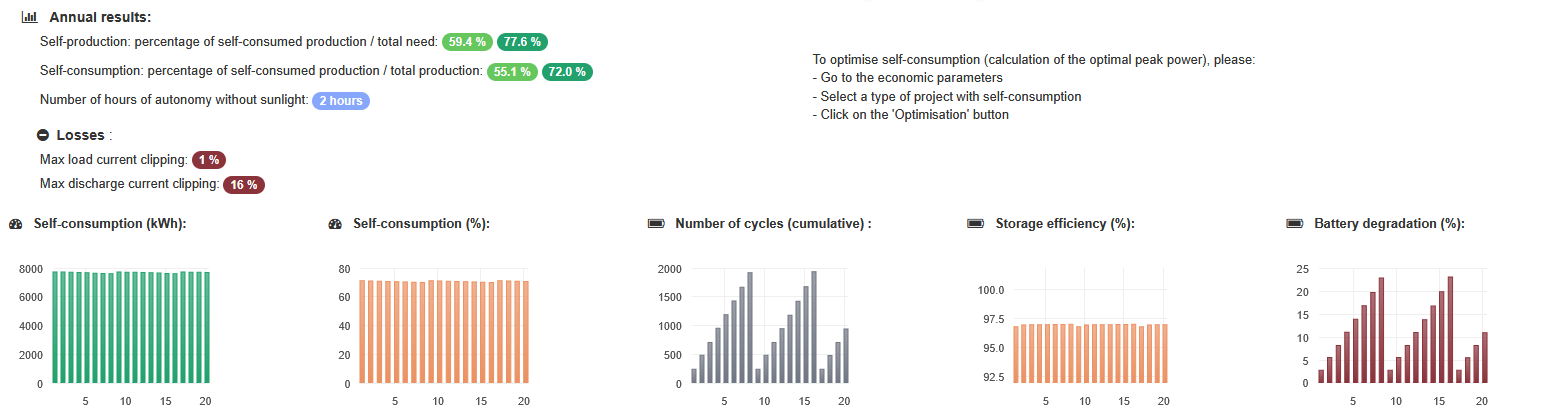
Self-consumption without storage: Total consumption from PV production
Self-consumption with storage: Total consumption from PV production + Stored PV energy
Number of hours of autonomy without sun: Number of hours during which the building's consumption can be covered by the energy stored by the batteries without.
-> Self-production rate with and without storage: Percentage of self-consumed production / total requirements
-> Self-consumption rate with and without storage: Percentage of self-consumed production / Total production
Maximum charge current clipping: Corresponds to the energy that cannot be charged into the battery because the charge current does not allow it.
Maximum discharge current clipping: Corresponds to the energy that cannot be drawn from the battery because the discharge current does not allow it.
Self-consumption (kWh): Allows you to view the annual self-consumption in kWh over the observation period.
Self-consumption (%): Allows you to view the annual self-consumption rate as a % over the observation period.
Number of cycles (cumulative): Allows you to view the number of cycles accumulated annually over the observation period.
Storage efficiency: Allows you to view the proportion of recoverable energy compared to the stored energy as a % over the observation period.
Battery degradation (%): Allows you to view the annual cumulative degradation rate of the battery over the observation period.
Understanding the technical specifications of a storage battery? batteryTechnicalSheet
Nominal Capacity: The nominal capacity of a battery is the maximum amount of energy, generally measured in kilowatt-hours (kWh), that the battery is designed to store. It is a theoretical measurement that assumes ideal operating conditions and a new, fully charged battery.
Monthly Self-Discharge (%): This describes a set of automatic electrochemical processes that cause batteries (accumulators) to discharge more or less quickly, even when no electrical load is connected. The rate of self-discharge determines how much of the initially stored charge (capacity) is still usable after storage. Self-discharge is one of the most important characteristics of batteries or accumulators.
C-rate (%): A battery's 'C-rate' defines the rate at which it charges or discharges relative to its maximum capacity. It is expressed in multiples of 'C'.
When the C-rate is given in hours, it represents the time required to fully charge or discharge the battery at that rate.
For example:
- A C-rate of 1h (C-rate: 1C) means that the battery will fully charge or discharge in 1 hour.
- A C-rate of 2h (C-rate: 0.5C or C/2) indicates that a full charge or discharge will take 2 hours.
- A C-rate of 0.5h (C-rate: 2C) means that the battery will be charged or discharged in 30 minutes.
- A C-rate of 10h (C-rate: 0.1C or C/10) indicates a charge or discharge in 10 hours.
The relationship is therefore inversely proportional: the smaller the number in front of the 'hour' unit, the higher the C-rate (expressed without a time unit) and the faster the charge or discharge.
How is nominal capacity calculated? calculateNominalCapacity
The formula for calculating battery storage capacity is relatively simple and involves multiplying the battery voltage by the battery's ampere-hour (Ah) rating. This value is then divided by 1000 to convert it to kilowatt-hours (kWh).
Storage Capacity (kWh) = Battery Voltage (V) x Battery Capacity (Ah) / 1000
It's important to note that a battery's ampere-hour rating is typically specified at a specific discharge rate. Therefore, it's essential to consider this factor when calculating the overall storage capacity of a battery system.
How to manage the economic valuation of virtual storage? ecoValuationStorageVirtual
Some energy suppliers offer electricity storage solutions in virtual 'batteries'. These solutions allow a photovoltaic electricity producer to virtually store kWh that would not have been self-consumed in order to use them later when the photovoltaic installation is not producing (at night, for example).
To take this type of solution* into account, the following data should be added to the economic analysis:
Commissioning cost: Any commissioning costs must be added to the project investment.
Annual subscription cost: This must be added to the maintenance and operating costs.
Subscribing to a virtual storage offer means taking out an electricity supply contract with the supplier of the virtual battery offer. The purchase tariffs for energy from this supplier must therefore be provided.
*Current economic management of virtual storage allows for the management of subscription offers that include the management of routing taxes. Support for offers with routing tax management independent of the subscription is planned for future developments.
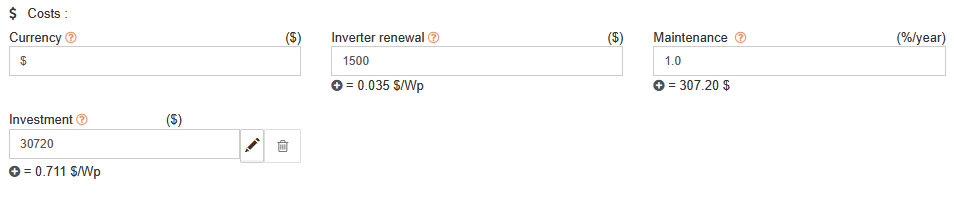
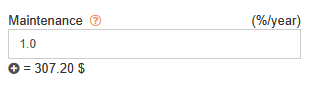
How to complete the economy section? economicData
Currency: The current currency can be changed here. This is the displayed currency, it does not imply changes in cost values.
Investment: Investment in the first year including bank loan and subsidies if applicable. It corresponds to the total cost of the project including material, implementation, commissioning. Enter the total cost of the project if it is already known.
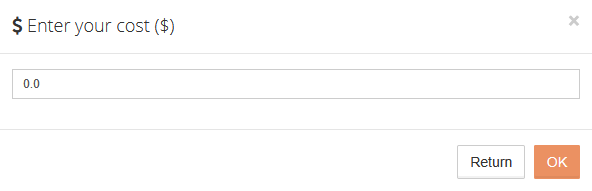
The button
 allows you, before the project, for example, to enter a cost per installed peak Watt based on the average costs observed depending on the type and size of the project.
Discounting: Discounting is the act
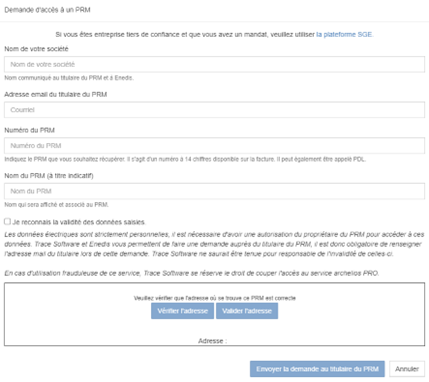
To request access to a load curve (consumption profile) from Enedis, from the Database tab of archelios PRO, you must click on the button: Request access to a PRM (or PDL) Enedis

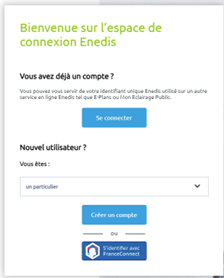
Validate that the technical prerequisites have been taken into account to access the load curve.
Data collection works subject to activation on the associated ENEDIS account. If data collection has not yet been activated, your access request may not be successful. The collection of data only starts when authorization is given, consequently consumption dating before this date is not taken into account.
Complete the information in the form, verify the address and validate the access request:
The request goes on hold in the summary table and the owner receives a validation request by email:
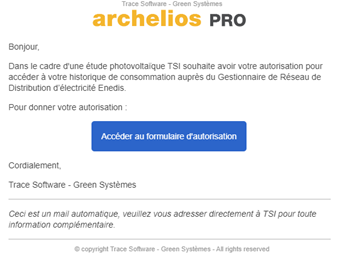
To give authorization, the owner of the meter must complete the online questionnaire:
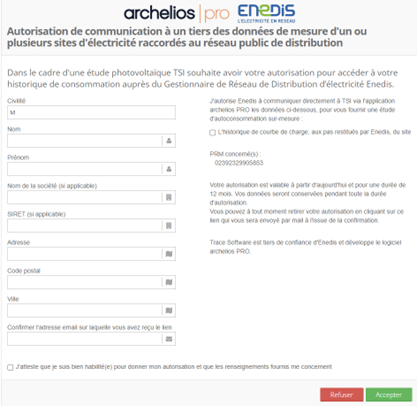
The owner receives an online notification of acceptance

And by email with the possibility of withdrawing your authorization.
Validation of withdrawal of authorization is done online
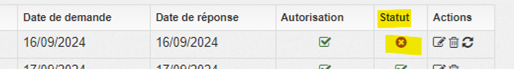
The different statuses of a request

Authorization and waiting for data from Enedis

Authorization and load curve available
Authorization and load curve not available (See dedicated article below)

Authorization refused or removed by the owner (Contact the owner)

Note: The local electricity authorities (Régie d'Électrcité d'Elbeuf, Gignac Énergie, Énergies & Services d'Electrcité de Bitche, Régie electric de Tignes...) are not affected by this API which is exclusively reserved for Enedis.
Hovering the mouse over the symbol allows you to read the following message:
And associate the Linky meter number with it:
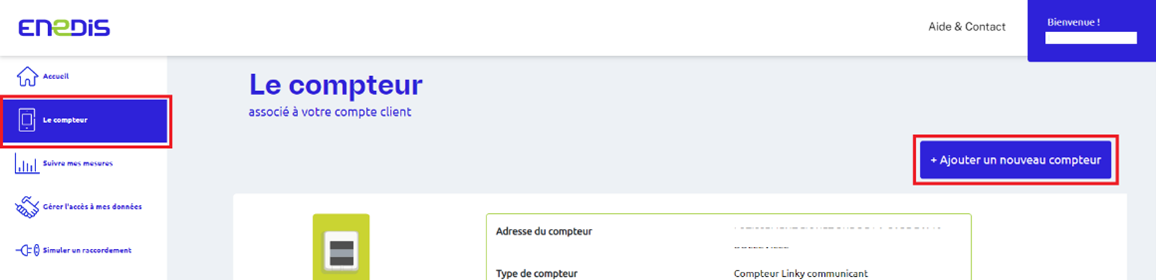
In the tab, manage access to my data, the owner of the meter can activate the collection and recording of the hourly consumption of the Linky meter:
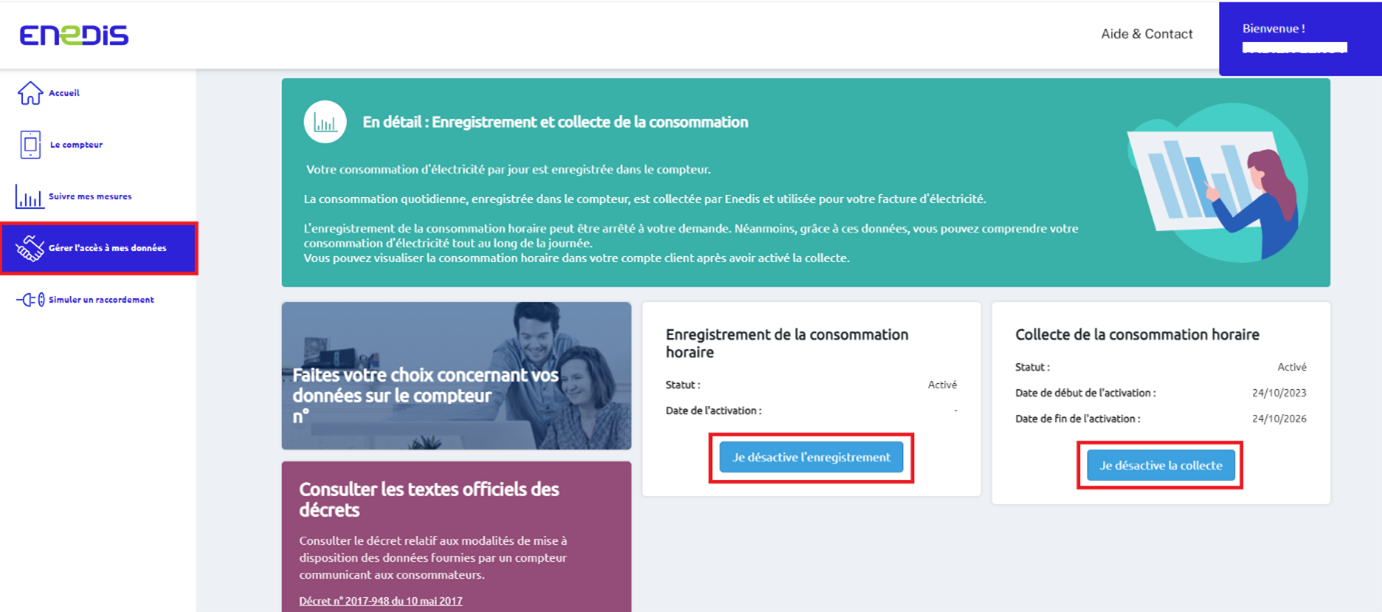
The collection and recording of data can also be done by contacting the energy supplier.
Outputs - Reports
How can I disable my pop-up blocker to generate the PDF report? disablePopupBlocker
Chrome : https://support.google.com/chrome/answer/95472?co=GENIE.Platform%3DDesktop&hl=en
Firefox : https://support.mozilla.org/en-US/kb/pop-blocker-settings-exceptions-troubleshooting
Internet Explorer : https://support.microsoft.com/en-us/help/17479/windows-internet-explorer-11-change-security-privacy-settings
How do I rename my groups, inverters and other items? preferencesDisplayNames
You can rename all items at once in the 'Settings' tab. You can choose from which item you want to start numbering. 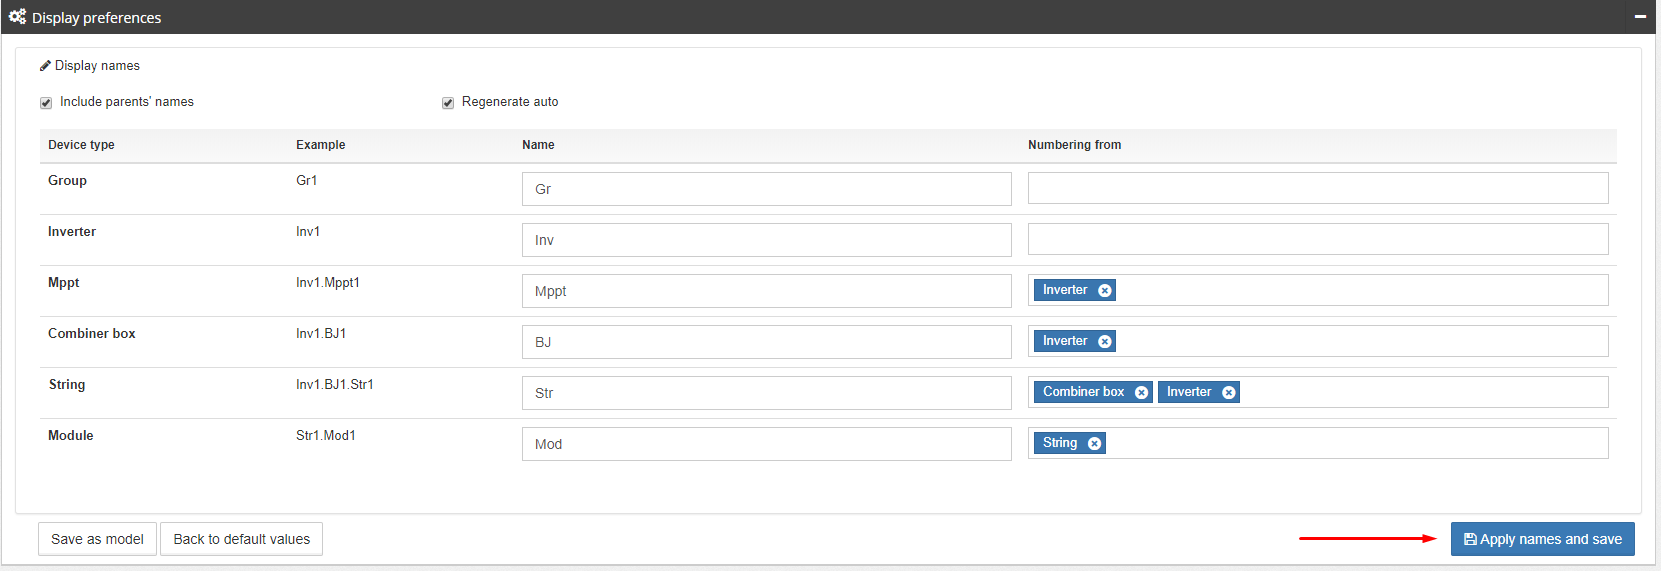
Do not forget to apply your changes.
You can also rename one element at a time by right-clicking on the element to open the context-sensitive menu. 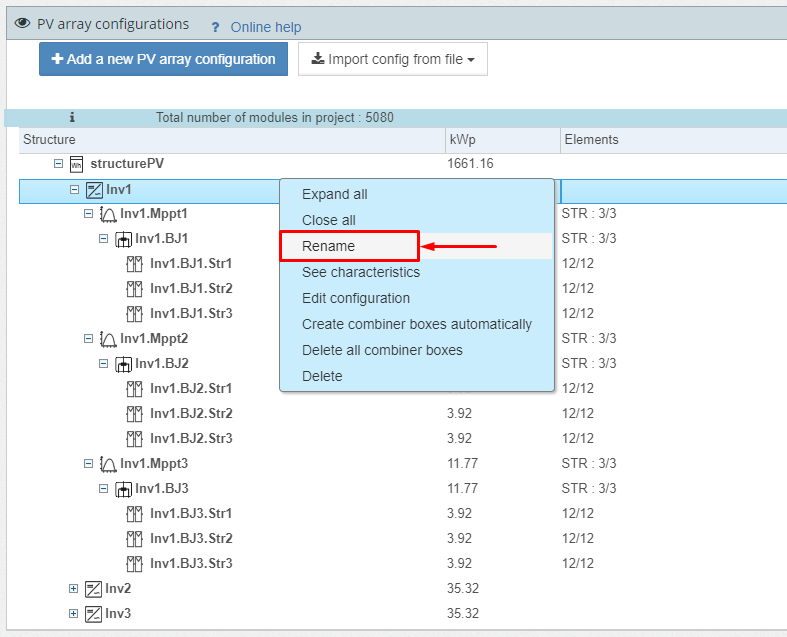
In this case, the inverter has been renamed without affecting the other inverters: 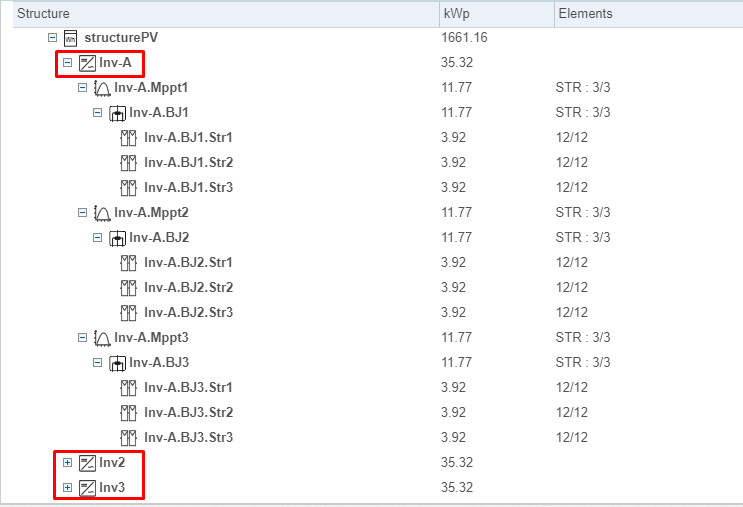
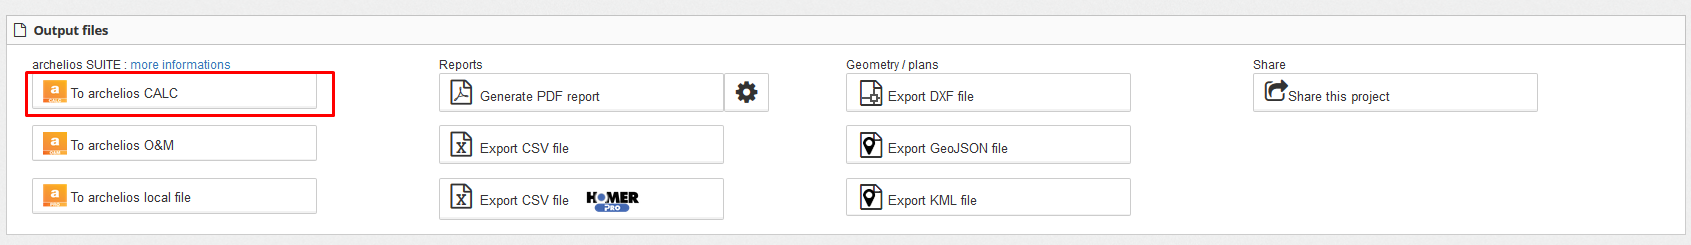
Then double click on the file saved on your computer or use the import option from archelios CALC

For more information about our archelios CALC software, visit : https://www.trace-software.com/products/archelios-calc/
Does archelios export to DXF file? exportDXF
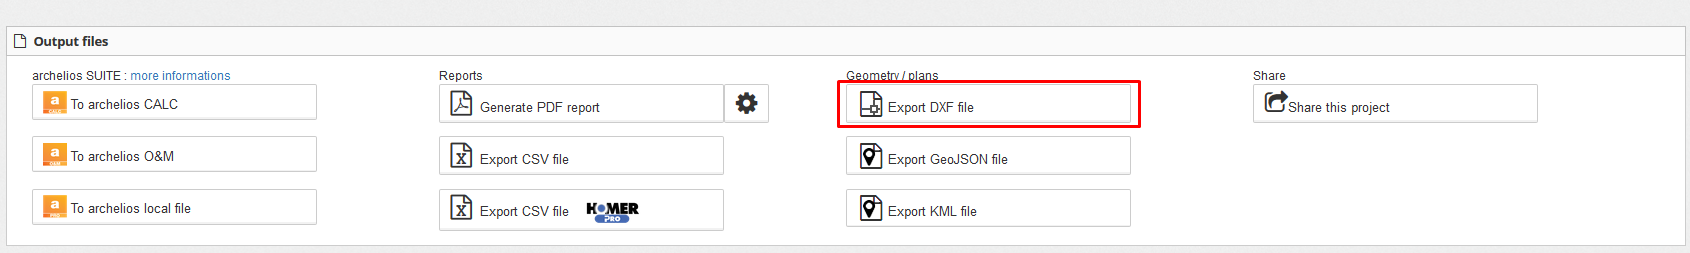
As for colours, the export to DXF depends on the archelios 3D view according to the drop-down list:
If you choose 'Group colour', the modules will be shown in the colour of the group that they belong to, and the same applies to 'Inverter / MPPT / string colour'. If you choose 'Irradiation colour', you will have the colour of the irradiance of each module (if previously calculated).
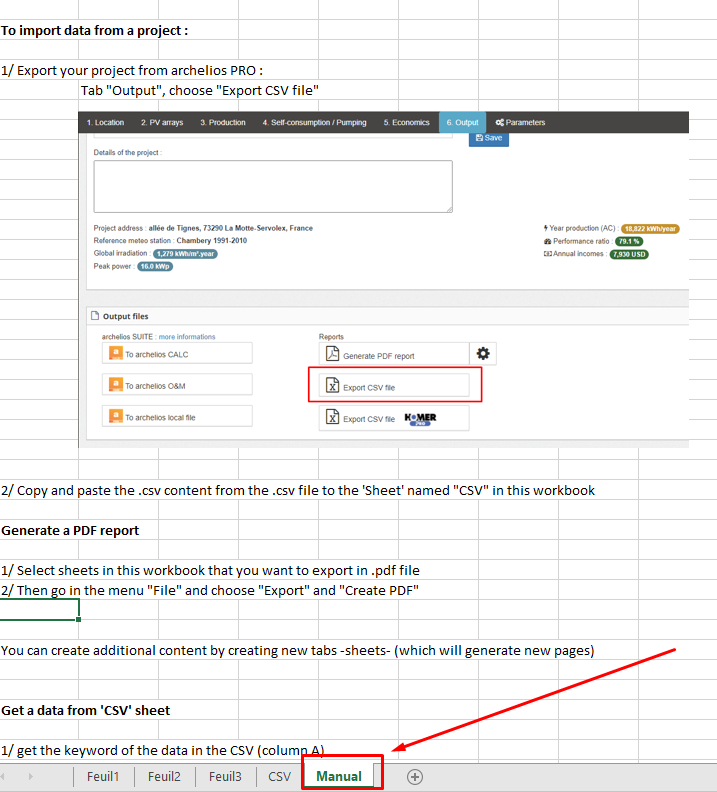
Does archelios export to Excel file? exportExcelTemplate
EN : TemplateExcelExport.xlsx
FR : TemplateExcelExport - FR.xlsx
DE : TemplateExcelExport - DE.xlsx
ES : TemplateExcelExport - ES.xlsx
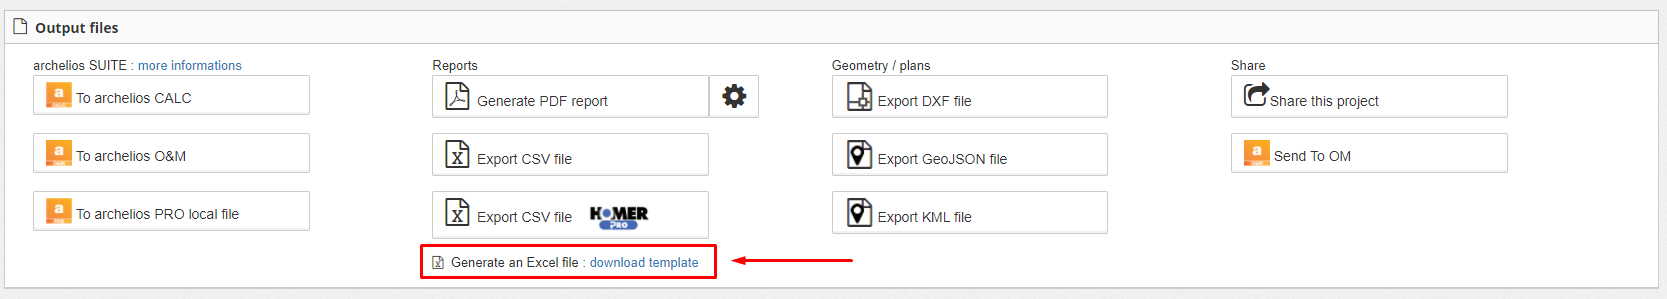
This file allows users to customise their output reports for presenting to their customers.
To find out how to use this file, refer to the dedicated 'Manual' tab which describes the steps to be taken.
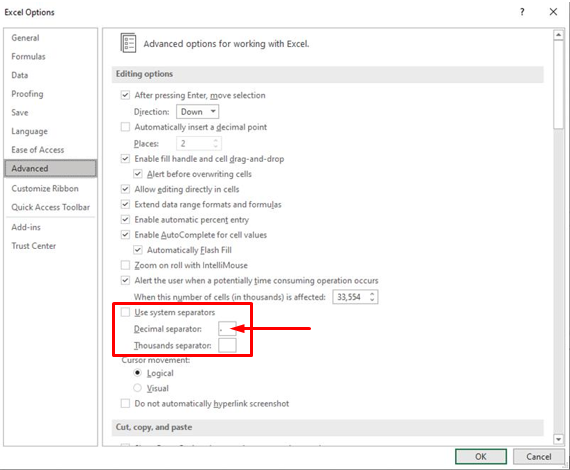
Please make sure that the decimal separator is a period '.' and not a comma ','.
Simulation model
Why do I notice a difference in production from the very first year compared to other software? otherSoftware
There are several reasons why the simulation results are different to other software:
- The weather data on which the simulation is based. The data in archelios PRO may be different to the data in the other software (data source, observation period, exact location, etc.). You can find the details of the weather source in the 'Location' tab. By default, archelios PRO uses Meteonorm data, but you may also import data from other sources here
- The simulation parameters. The default values in the simulation parameters (last tab) are realistic, but they might not exactly correspond to your project or the values present in other software. These assumptions can obviously be modified, depending on your experience (e.g. soiled modules) or your knowledge of the project's more specific data (such as losses in cables or module tolerance levels).
- The simulation models. archelios PRO includes models that are known and published in scientific literature. Thanks to studies into the accuracy of the modelling process, the production results produced by several software programs can be benchmarked against real results by eliminating the two previous biases.
- Photon study
- IJEEE study
Why do I find days with very low production? weatherDataProcessing
By default, weather data is sourced from Meteonorm software. Monthly averages, generally covering a 19-year period (the period is indicated in the weather station's name), are processed by archelios to generate hourly irradiance data representative of an average year.The method used (parts of which are determined randomly) allows for the simulation of more or less sunny days, with intra-day variations, which explains days with very low production, or peaks and troughs in production within the same day.However, the method ensures that for each month, the sum of the irradiation from these 'real' days is equal to the monthly average from the Meteonorm weather station.Furthermore, to guarantee the repeatability of simulation results from one project to another, the random nature of the method is constrained so that the series of 'real' days is always the same.
The Pxx energy yield represents the degree of uncertainty used during the calculation.
The P50 energy yield is the mean production level, meaning that there is a 50% chance of exceeding the energy yield.
The P90 energy yield means that there is a 90% chance of exceeding the production level, while combining all the uncertainties.
The following parameters are the different uncertainties used when calculating the P90 energy yield.
Therefore, they only influence this result.
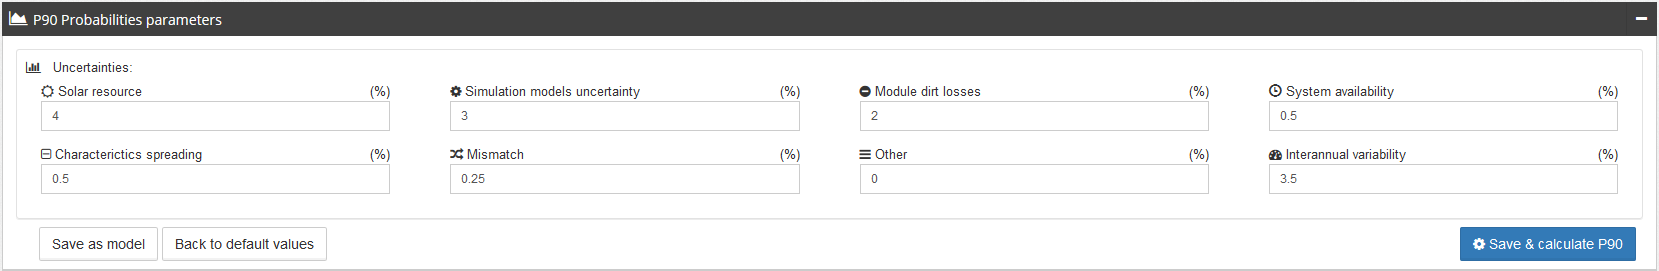
This means that these parameters are different from those used for the simulation, since they determine the uncertainties relating to the assumptions used for the simulation parameters.
The parameters defined in the 'P90' section are the uncertainty percentages relating to the assumptions used for the simulation parameters.
Let's take the example of 'Characteristic mismatch'. You have a parameter that is taken directly into account in the simulation (e.g. 1%). This 1% has a direct influence on the simulation. In the P90 section, the specified percentage will correspond to the uncertainty (standard deviation) associated with this parameter. If you put 0%, it means that you're sure of the assumptions for your simulation.
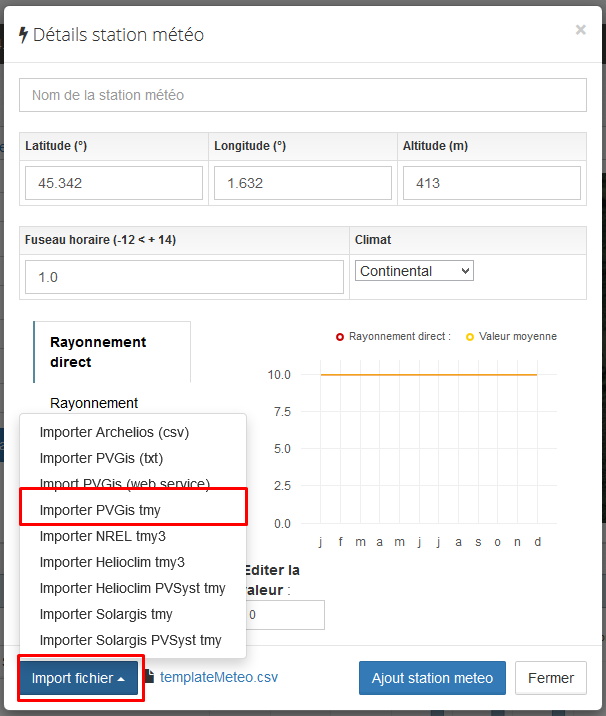
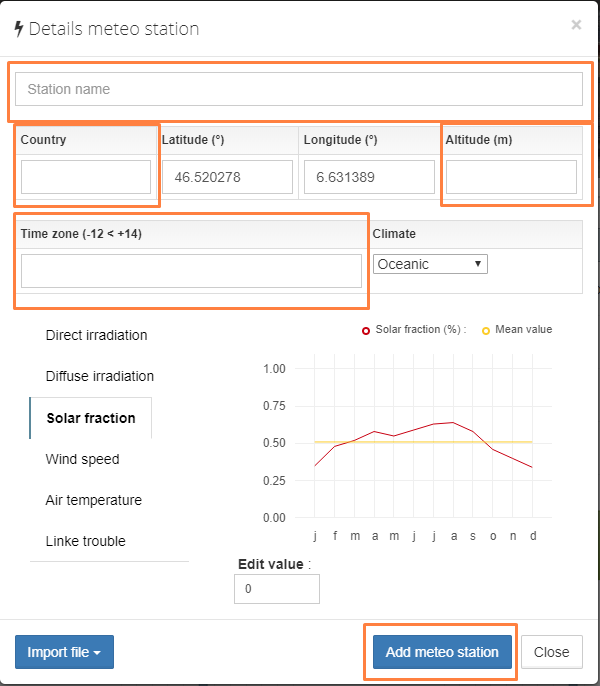
How do I import my data to create a new weather station? importWeatherStation
You can add a new weather station by clicking on the 'Weather station' button after the first calculation.
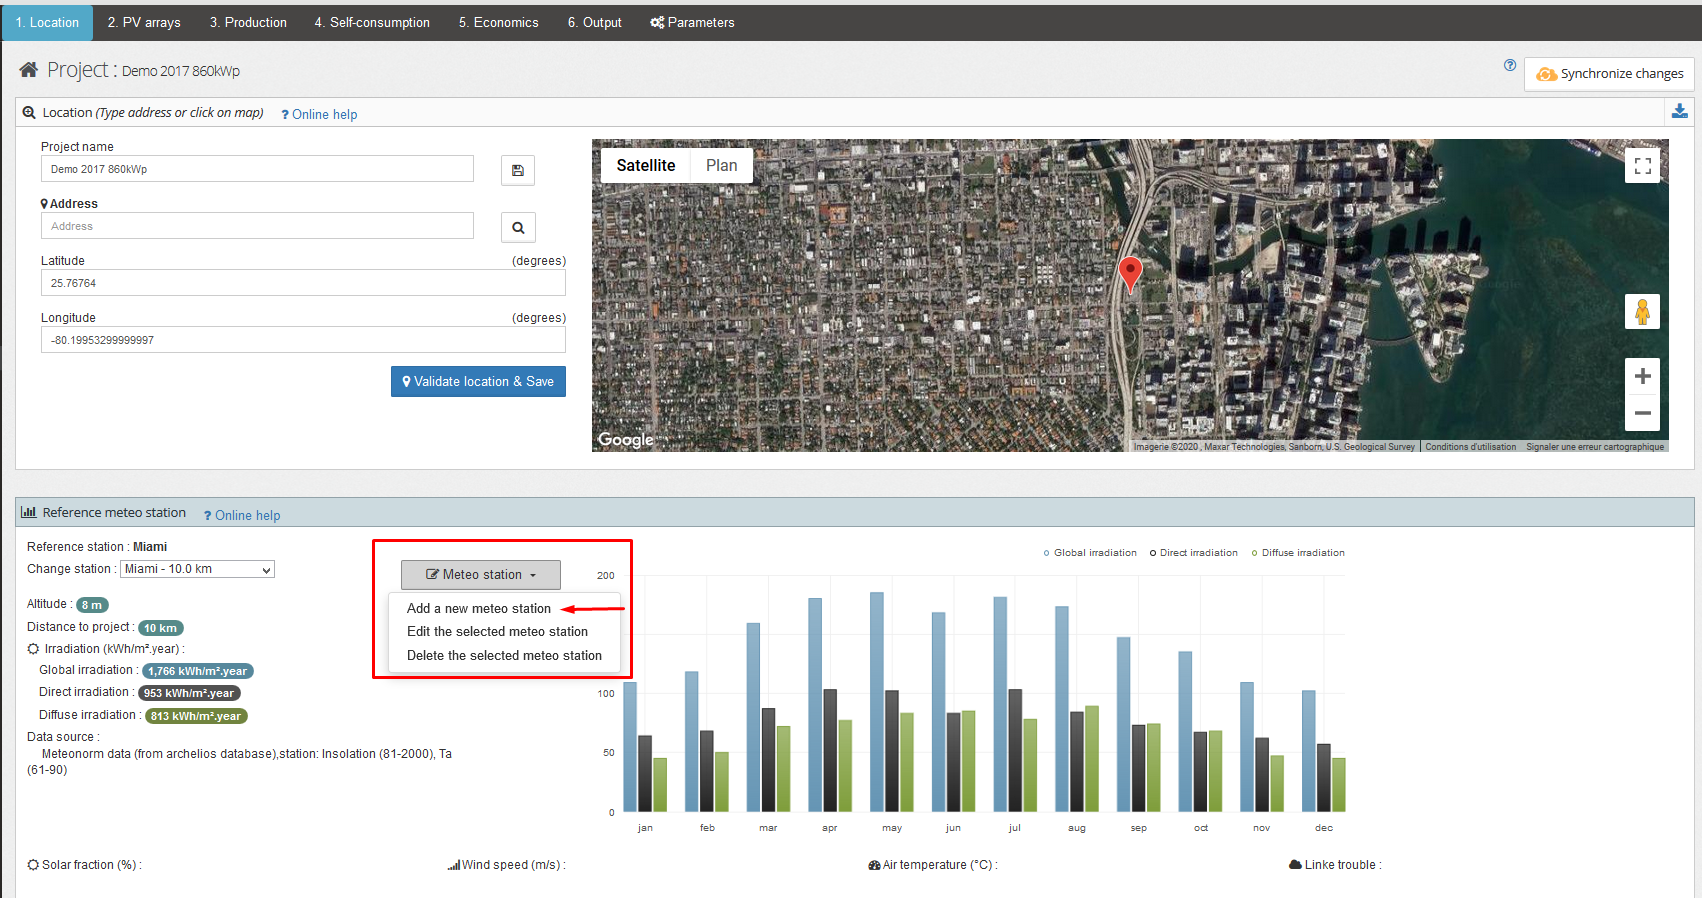
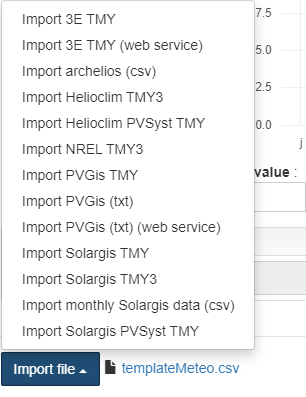
Several types of imports are available
The formats with daily and hourly data are transformed into average monthly days (24 hours per average day / month).
Since these data are retransformed, an 'actual days' profile is recreated when calculating the self-consumption and clipping.
Here are some template files you can download:
How do I import a weather station from PVGis? importStationPVGis
What is the purpose of the 'Irradiation in the plane' window in the 'Site' section? informationsIrradianceSitePart
The 'Site' section displays information, but is also useful for calculating the energy subsequently produced
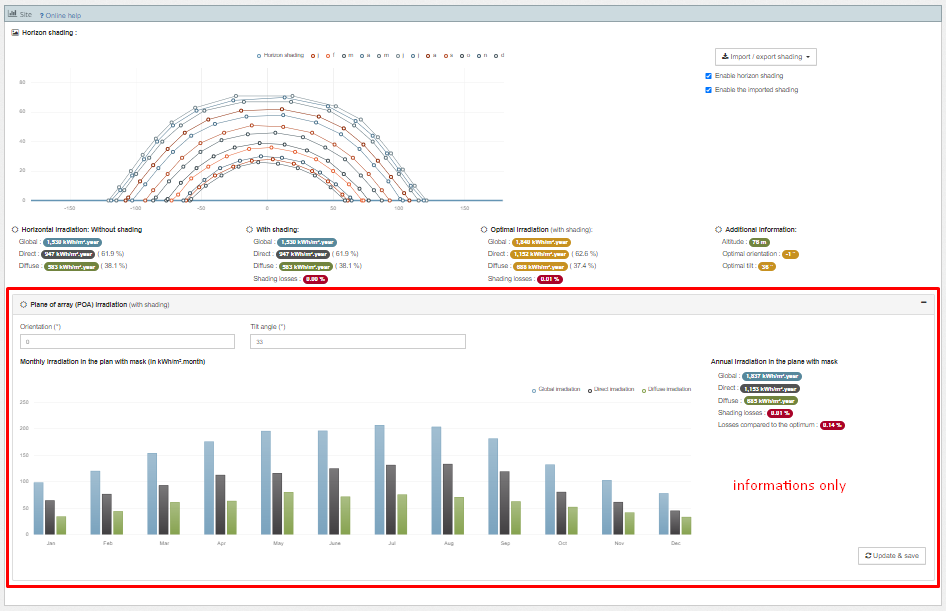
This can help you choose the best tilt and orientation (if permitted by the project). The section in red is for your information only (it does not affect the project)
The REAL orientation and tilt of the modules are defined in tab 2 (configurations).
archelios calculates the true irradiance in the module plane to simulate the energy production of the project.
How is the bifacial gain calculated? bifacialModel
The bifacial gain is based on the additional contribution made by the back face of the module. This contribution is calculated every hour from the irradiance on the back face and the bifaciality factor. A mismatch loss factor is also applied.
The back face irradiance includes :
- Direct irradiance: same calculation as for the front face
- Diffuse irradiance :
- Circumsolar diffuse: same calculation as for the front face
- Isotropic diffuse: the calculation is based on the portion of sky seen from the back face (taking account of the module rows behind)
- Albedo-related diffuse irradiance, which is equal to the radiation reflected by the ground and weighted by the view factor of the back face from the ground The radiation reflected by the ground takes account of shading caused by the rows of modules
By hypothesis, the rows of modules are infinite.
How is the solar pumping system sized? solarPumpingModel
- Calculation of the storage volume from the required number of days of autonomy and the daily need
- Calculation of peak power based on a daily calculation (365 days): the peak power is calculated iteratively, while checking that the need is still fulfilled and by taking account of the storage volume previously calculated. The calculation factors in the system's performance. By default, a monthly tolerance of 5% is taken into account, i.e. archelios accepts that the monthly deficit is no more than 5% of the value of the monthly requirement.
- Calculation of pump power from the peak power, considering an oversizing coefficient of 5%
The IAM is calculated with the ASHRAE model. The default b0 value for the formula is 0.05.
Improvements to the model 2018 improveModel2018
- IAM losses on diffuse irradiation
- update to the default values for the simulation parameters
Improvements to the model 2017 improveModel2017
- Power losses in the cables are now calculated from the losses at STC (and not from a simple percentage of the losses). Depending on the conditions, if you enter 1% for the losses at STC, you'll have approximately 0.5 to 0.7% for the whole year.
- Configuration-level production is now computed from the I-V curves for each module
- Minor modification concerning the module temperature model
3Dmap features
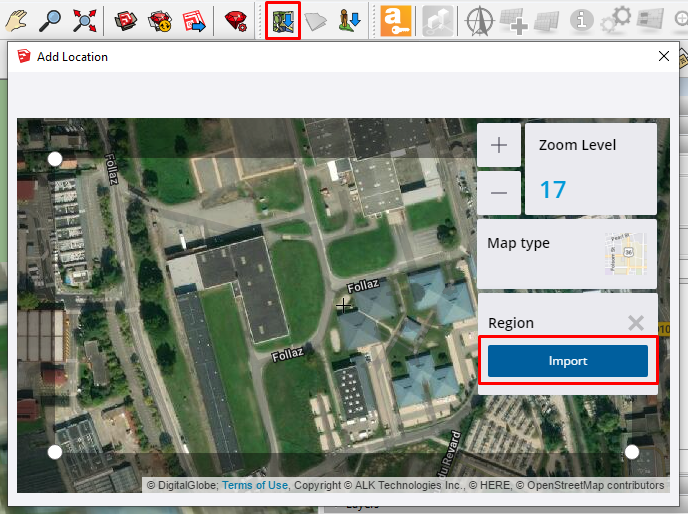
How do I import an area into my model? 3DMap_use
-
Geolocate the SketchUp project :
-
Open the 3DMap feature :
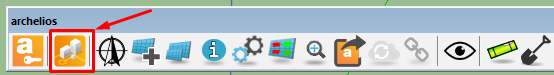
-
Choose an area and import it :
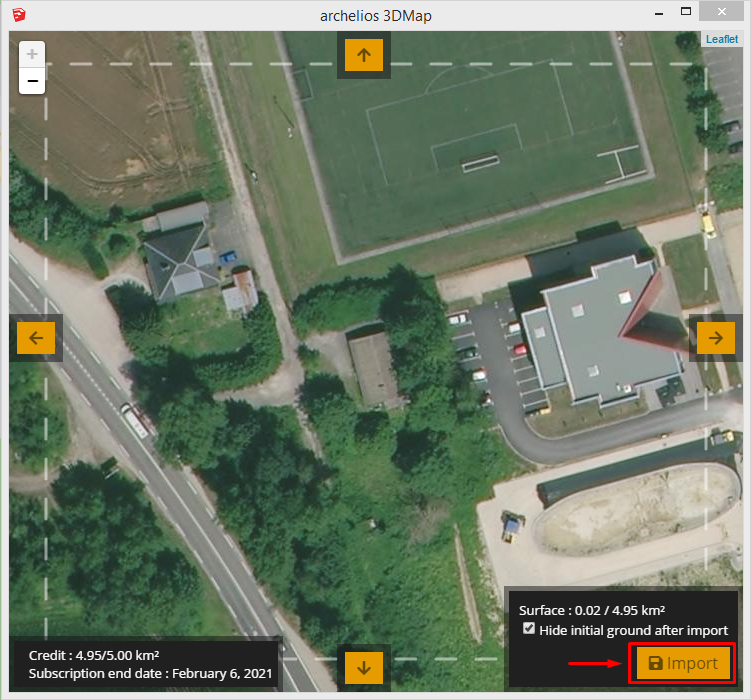
You can import multiple areas
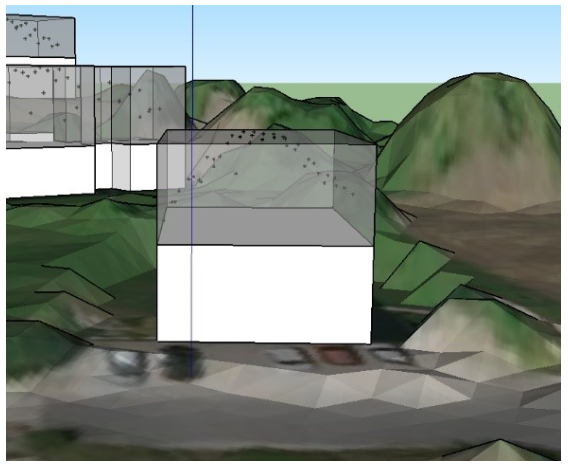
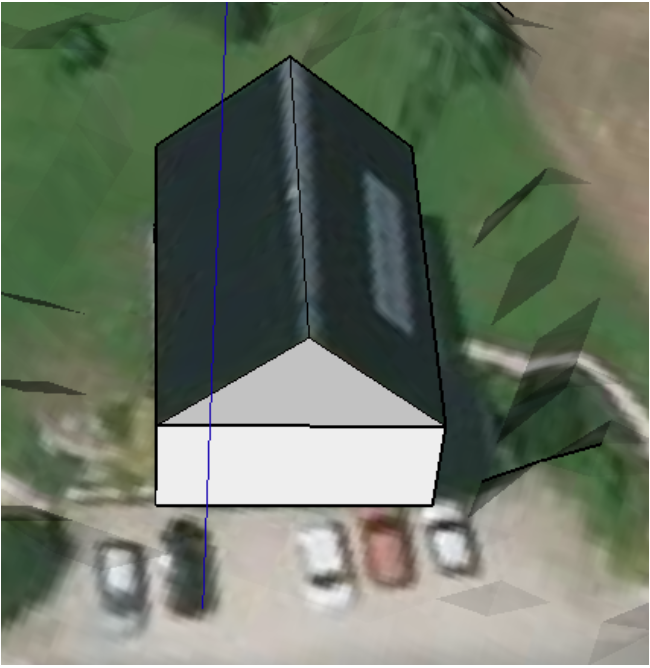
What are the different data imported? 3DMap_buildings
-
Textured ground
-
In white: the body of the building up to the height of the gutter
-
Transparent: the roof from the gutter to the ridge
-
The points: points of the roof from the DSM data
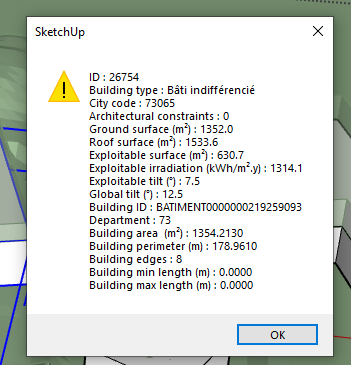
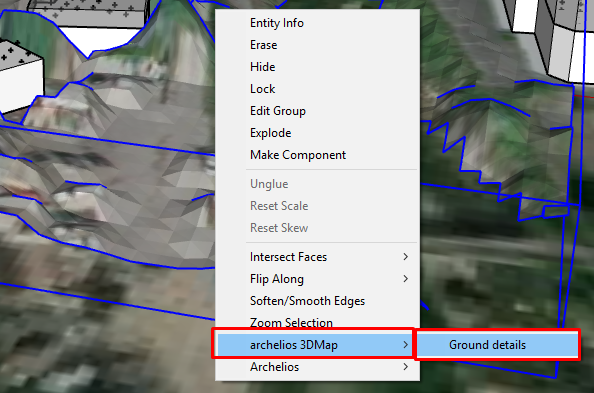
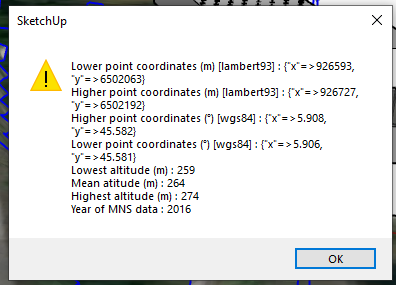
Can I access the building and ground data? 3DMap_info
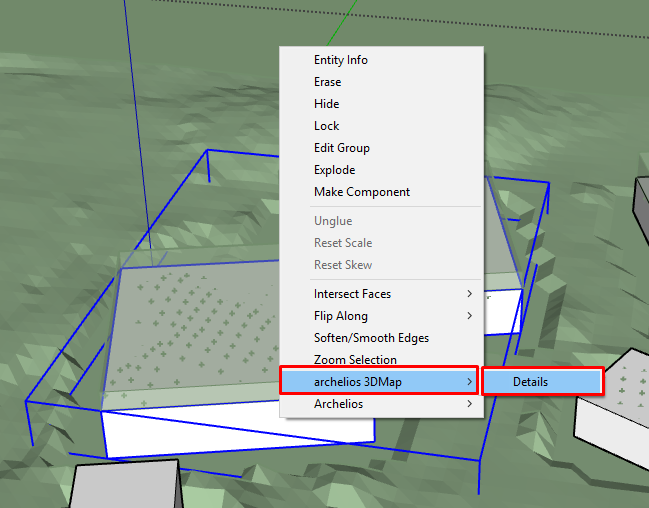
 To view ground information, please select a ground and right-click on it :
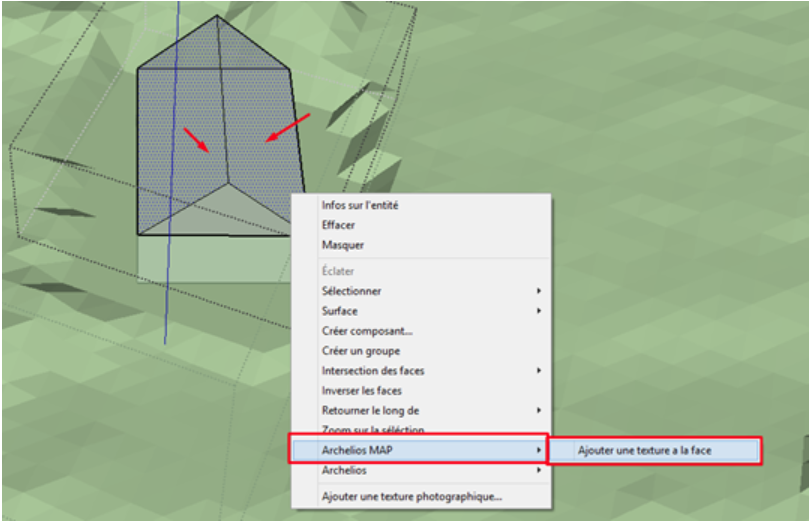
Can you add the orthophoto texture to the roof? 3DMap_roofphoto
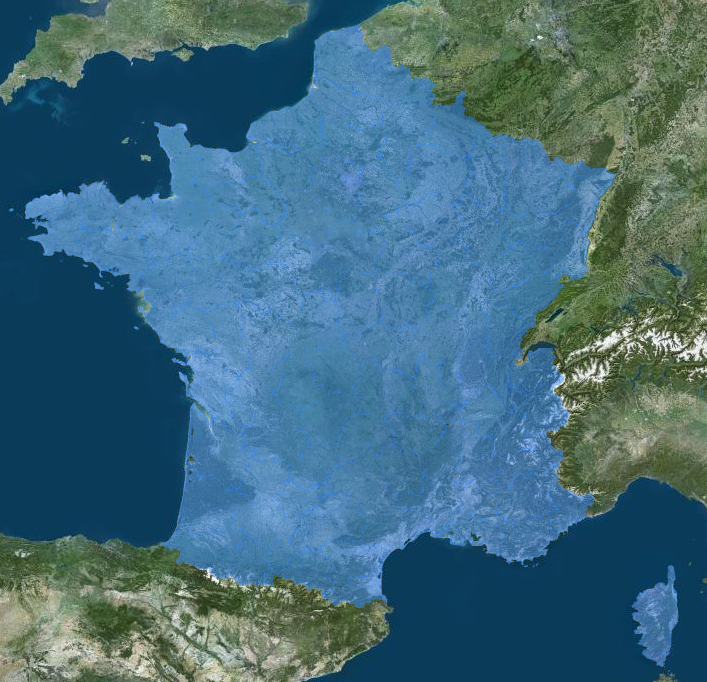
What is the coverage area of the feature? 3DMap_data
What is the difference between a weather station and a site? differenceWeatherSite
In the 'Weather station reference' section, you can view the weather station values used for the calculations: these values generally correspond to major cities. The 'Site' section depends on the exact geographical location of the photovoltaic system, i.e. coordinates and altitude. This information is used to calculate the sun path and make any altitude corrections.
How is the project profitability calculated? profitability
Does archelios work for sites located in the southern hemisphere? southernHemisphere
What is the albedo? albedoDefinition
- Cultivated field, asphalt : 0.15
- Ploughed ground, cobblestones, stones, rocks : 0.2
- Dry sand, grassland, meadows, concrete, gravel : 0.25
- Desert, sea : 0.3
- Old snow : 0.6
- Fresh snow, white paint, lime, dry white plaster : 0.8
LCOE lcoe
Therefore, this is the cost per kWh produced by the installation (expressed as €/kWh).